

Type in search terms.
SECTION 7: ASSESSMENT OF EFFECTS ON SURFACE WATER RESOURCES
Webequie Supply Road Project
May 1, 2025
AtkinsRéalis Ref: 661910
Draft Environmental Assessment Report / Impact Statement
SECTION 7: ASSESSMENT OF EFFECTS ON SURFACE WATER RESOURCES

Contents
- Assessment of Effects on Surface Water Resources………………………………………………………………. 7-5
- Scope of the Assessment………………………………………………………………………………………….. 7-5
- Existing Conditions…………………………………………………………………………………………………. 7-27
- Methods…………………………………………………………………………………………………. 7-27
Contents (Cont’d)
- Accidental Spills and Leaks………………………………………………………………………… 7-53
wash water………………………………………………………………… 7-70
runoff rates and volumes………………………………………………. 7-70
- Installation of waterbody crossing structures leading to temporary changes to discharge rates upstream or
downstream of waterbody crossings……………………………….. 7-71
- Permanent waterbody crossings leading to changes in localhydraulics (flow depth/water level and velocity)………………….. 7-71
or wash water…………………………………………………………….. 7-72
- Blasting activities releasing chemical constituents into nearbywaterbodies……………………………………………………… 7-72
sediment into waterbodies…………………………………………….. 7-72
or wash water runoff……………………………………………………. 7-73
- Blasting activities releasing chemical constituents into nearbywaterbodies……………………………………………………… 7-73
sediment into waterbodies…………………………………………….. 7-73
Contents (Cont’d)
In-Text Figures
Figure 7.1: Surface Water Resources Study Areas…………………………………………………………………………… 7-24
Figure 7.2: Surface Water and Sediment Sampling Locations……………………………………………………………… 7-28
Figure 7.3: Waterbody Crossings and their Watersheds…………………………………………………………………….. 7-30
In-Text Tables
Table 7-1: Key Regulation, Legislation, Policy Relevant to Surface Water Resources Assessment for
the Project…………………………………………………………………………………………………………………. 7-6
Table 7-2: Surface Water Resources VC – Summary of Inputs Received During Engagement and Consultation………………………………………………………………………………………………………………. 7-9
Table 7-3: Surface Water Resources VC – Summary of Indigenous Knowledge and Land and Resource
Use Information…………………………………………………………………………………………………………. 7-17
Table 7-4: Surface Water Resources VC – Subcomponents, Indicators, and Rationale…………………………….. 7-22
Table 7.6: Water Quality Sampling Sites……………………………………………………………………………………….. 7-32
Table 7-7: Surface Water Quality – Summary of Field Measuring and Laboratory Analytical Parameters
Collected in 2019, 2020, 2021, and 2023…………………………………………………………………………. 7-32
Table 7-8: Sediment Quality Sampling Sites…………………………………………………………………………………… 7-33
Table 7-9: Sediment Quality – Summary of Field Measuring and Laboratory Analytical Parameters
Collected in 2020……………………………………………………………………………………………………….. 7-34
Table 7-14: Summary of Potential Effects, Mitigation Measures, and Predicted Net Effects for Surface Water Resources VC…………………………………………………………………………………………………………… 7-57
Table 7-16: Summary of Predicted Net Effects on Surface Water Resources VC………………………………………. 7-74
7. Assessment of Effects on Surface Water Resources
Surface water resources were identified as one of the valued components (VC) during the VC scoping and selection as part of the Environmental Assessment / Impact Assessment (EA/IA) process. This section describes and assesses the potential effects that the Project may have on the Surface Water Resources VC.
Existing conditions for the surface water resources have been established through the field work programs, desktop studies and engagement and consultation activities completed by the Project Team. This includes, but not limited to, background information review, internet research, surface water and sediment sampling, hydrologic and hydraulic analysis, engagement with Indigenous communities and stakeholders, and expert opinion. The existing conditions are being used as baseline conditions to assess and determine the potential effects of the Project. The results of the baseline studies are provided in Appendix F – Natural Environment Existing Conditions (NEEC) Report.
The assessment of potential effects for the Surface Water Resources VC is presented in the following manner:
- Scope of the Assessment;
- Existing Conditions Summary;
- Potential Effects, Pathways and Indicators;
- Mitigation Measures;
- Characterization of Net Effects;
- Determination of Significance;
- Cumulative Effects;
- Prediction of Confidence in the Assessment;
- Predicted future Condition of the Environment if the Project Does Not Proceed;
- Follow-up and Monitoring Programs; and
- References.
7.1 Scope of the Assessment
7.1.1 Regulatory and Policy Setting
The Surface Water Resources VC is assessed in accordance with the requirements of the Impact Assessment Act, the Ontario Environmental Assessment Act, the Tailored Impact Statement Guidelines (TISG) for the Project (Appendix A-1), the provincial approved EA Terms of Reference (ToR) (Appendix A-2), and EA/IA guidance documents.
Table 7-1 outlines the key regulations, legislation, and policies relevant to the assessment of the Surface Water Resources VC for construction and operations of the Project.
Table 7-1: Key Regulation, Legislation, Policy Relevant to Surface Water Resources
| Regulatory Agency | Regulation, Legislation, or Policy | Project Relevance |
| Federal | ||
| Impact Assessment Agency of Canada (IAAC) | Impact Assessment Act | The Project is subject to the federal Impact Assessment Act (refer to Section 2). The Tailored Impact Statement Guidelines (TISG) issued by IAAC (2020) for the Project were used to identify requirements for the assessment of Surface Water Resources VC. |
| Fisheries and Oceans Canada (DFO) | Fisheries Act | Protection of fish, fish habitat, and fish for human use is required through Sections 34, 35 and 36 of the Fisheries Act. This includes pollution prevention measures that prohibit deposition of deleterious substances within high-water mark of all fish bearing water courses. The Fisheries Act also has provisions that: Ensure the safe passage of fish;Require unobstructed flow of water and passage of fish; andRequire water intakes and diversions to have a fish guard or fish screen. |
| Environment and Climate Change Canada | Species at Risk Act | Work or undertaking that may result in changes to surface water quality (including wetlands) and affect Species at Risk habitat. |
| Health Canada | Canadian Drinking Water Quality Guidelines | The guidelines include benchmark concentrations for contaminants of interest used to screen existing conditions as part of the Assessment of Effects on Human Health (Section 17). |
| Canadian Council of Ministers of the Environment (CCME) | Canadian Water Quality Guidelines for the Protection of Aquatic Life | The CCME set water quality guidelines for Protection of Aquatic Life (CCME, 2023). These guidelines can be used for tracking changes at one site over time and comparisons among sites. These guidelines are used for water quality management across Canada and are not used for assessing regulatory compliance. |
| Canadian Sediment Quality Guidelines for the Protection of Freshwater Aquatic Life, Interim Sediment Quality Guidelines (ISQG; CCME, 1999) | The CCME set sediment quality guidelines for protection of freshwater aquatic life (CCME, 1999). These guidelines can be used for tracking changes at one site over time and comparisons among sites. These guidelines are used for sediment quality management across Canada and are used for assessing regulatory compliance. | |
| Canadian Environmental Quality Guidelines (CEQG), Soil Quality Guidelines for the Protection of Environmental and Human Health (SQG PEHH; CCME, 1999) | The CCME set soil quality guidelines for protection of environmental and human health (CCME, 1999). These guidelines can be used for tracking changes at one site over time and comparisons among sites. These guidelines are used for soil quality management across Canada and are used for assessing regulatory compliance. | |
| Regulatory Agency | Regulation, Legislation, or Policy | Project Relevance |
| Transport Canada | Canadian Navigable Waters Act (CNWA) | The CNWA is applicable to navigable waters as included in the list of scheduled waters, as well as non-scheduled waters that are navigable. There are no crossings of waterbodies listed in the Schedule to the Act designating Navigable Waters, but there will be major, minor, and other works on unlisted waterways deemed to be navigable that will be subject to the Act’s provisions. |
| Provincial | ||
| Minister of the Environment, Conservation and Parks (MECP) | Ontario Environmental Assessment Act | The Project is subject to the Ontario Environmental Assessment Act. The ToR (Webequie First Nation, 2020), which was approved by the MECP on October 8, 2021, were used to identify requirements for the assessment of Surface Water Resources VC. |
| MECP | Ontario Environmental Protection Act | An Environmental Compliance Approvals under the Act may be required for the discharge and treatment of wastewater generated from some water takings. |
| MECP | Ontario Water Resources Act | A permit to take water (PTTW) or Environmental Activity and Sector Registration (EASR) under the Act is required for water takings associated with project activities such as pumping, draining, and dewatering. Dependent upon meeting specific criteria (e.g., water source, purpose, etc.) of the Water Taking EASR Regulation – O. Reg. 63/16, some takings between 50,000 and 400,000 L/day may qualify for registry (EASR), while other takings (e.g., associated with aggregate pit) may require a PTTW. Takings over 400,000 L/day require a PTTW. |
| MECP | Provincial Water Quality Objectives | The Water Management – Policies, Guidelines, Provincial Water Quality Objectives of the Ministry of the Environment (MOE, 1994) established acceptable limits as numerical and narrative criteria that include chemical and physical parameters and provided direction on how to manage: Surface water quality to protect aquatic life and recreation uses; andSurface water quantity for a fair-sharing, conservation, and sustainability of the resource. |
| MECP | Ontario Drinking Water Quality Standards under the Safe Drinking Water Act | Ontario Drinking Water Quality Standards (O. Reg. 169/03; current as of January 1, 2020) are used to screen existing conditions as part of the Assessment of Effects on Human Health (Section 17). |
| MECP | Ontario Soil, Groundwater and Sediment Standards for use under Part XV.1 of the Environmental Protection Act | Ontario’s Soil, Ground Water and Sediment Standards (MOE, 2011) set out the prescribed contaminants and the applicable site condition standards for those contaminants for the purposes of Part XV.1 of the Environmental Protection Act. |
| Regulatory Agency | Regulation, Legislation, or Policy | Project Relevance |
| MECP | Guidelines for Identifying, Assessing and Managing Contaminated Sediments in Ontario: An integrated approach (MECP, 2008) | Ontario Provincial Sediment Quality Guidelines, Lowest Effect Level (LEL) criteria are used to screen existing sediment conditions that can be tolerated by the majority of sediment- dwelling organisms. Sediments meeting the LEL are considered clean to marginally polluted. |
| MECP | Water Management: Policies, Guidelines, Provincial Water Quality Objectives (PWQO), 1994 (as amended) | During road construction and aggregate pit operations, dewatering effluent should meet PWQO criteria as the water will be discharged to the natural environment (overland) and may enter surface water bodies. |
| MECP | Environmental Compliance Approval (ECA) | Wastewater treatment systems/units (e.g., septic systems) will require an ECA from the MECP. |
| Ontario Ministry of Transportation (MTO) | Ontario Provincial Standard Specifications (OPSS) | Dewatering activities during road construction and aggregate pit operations should follow OPSS 517 Dewatering of Pipeline, Utility, and Associated Structure Excavation; OPSS 518 Construction Specification for Control of Water from Dewatering Operations; and OPSS 805 Construction Specification for Temporary Erosion and Sediment Control Measures, at a minimum. Blasting should be conducted in accordance with OPSS 120 General Specification for the Use of Explosive. |
| Ontario Ministry of Natural Resources (MNR) | Environmental Guidelines for Access Roads and Water Crossings (MNR, 1990) under Environmental Assessment Act and Lakes and Rivers Improvement Act | Although developed for use as support to the Class EA for Timber Management, this guideline document includes mandatory standards, good practice guidelines, and mitigation techniques and has application to all access roads on Crown land in Ontario, regardless of their purpose. |
| Other | ||
| Webequie First Nation | Webequie First Nation On-Reserve Land Use Plan | Environmental protection guidelines outline Environmentally Sensitive Areas that are protected from development impacts and include waterways and waterbodies (Webequie First Nation, 2019a). |
| Webequie First Nation | Webequie First Nation draft Community Based Land Use Plan | Webequie First Nation and Ontario have committed to gather baseline environmental data in the Ring of Fire area and track changes in environmental and ecological conditions in the area over time. Ecological systems of focus include water systems and wetlands (Webequie First Nation, 2019b). |
7.1.2 Consideration of Input from Engagement and Consultation Activities
Table 7-2 summarizes input related to Surface Water Resources received during the engagement and consultation for the EA/IA and how inputs are addressed in the EAR/IS. This input includes concerns raised by Indigenous communities and groups, the public, government agencies, and stakeholders prior to the formal commencement of the federal IA and provincial EA, during the Planning Phase of the IA and ToR phase of the EA.
Table 7-2: Surface Water Resources VC – Summary of Inputs Received During Engagement and Consultation
| Comment Theme | How the Comments are Addressed in this Draft EAR/IS | Indigenous Community or Stakeholder |
| Concerns regarding potential effects of dewatering resulting in increased methylmercury, mobilization of methylmercury through changed water flows, downstream impacts of methylmercury to waters and fish and how climate change will exacerbate these effects. Attawapiskat First Nation requested that MECP be directly involved in designing and overseeing a water management plan for the Webequie Supply Road (WSR) to protect the Ekwan and Attawapiskat watersheds from contamination and minimizes hydrological changes to downstream environments. Attawapiskat First Nation noted that the community is already experiencing mercury contamination stemming from the Victor Mine and requires that the EA/IA includes a technical analysis of the cumulative impact of contamination from the WSR and the Victor Mine, and that the EA/IA proposes a plan for mitigating those impacts in the construction and operation phases of the WSR. | As described in Section 4 (Project Description), the proposed WSR is a linear facility, with no major obstruction to the water flow or to the hydrology of low-lying areas. Planned water crossings (rivers or waterbodies) will be designed not to change the downstream hydrology (i.e., water flow and levels). Where the road passes through low-lying areas and has the potential to change the local hydrology, mitigation measures including, but not limited to, equalization culverts, drainage blankets and/or subdrains will be placed to minimize or eliminate any such changes. Potential effects of temporary dewatering are assessed in Section 7.3 and Section 8.3. With the implementation of mitigation measures for dewatering as outlined in Section 7.4, Section 8.4, and Appendix E of this EAR/IS, there are no expected permanent changes to either the regional surface water conditions/hydrology or the regional groundwater conditions in the area. No dewatering is anticipated to result in significant permanent changes in the characteristics of the peatland and organics in its vicinity. Methylmercury and other water quality concerns (parameters) have been included in the surface water baseline investigation program. Surface water quality was monitored for seasonal and annual changes during the EA/IA process. As indicated in Section 4 (Project Description), a Surface Water and Storm Water Management and Monitoring Plan will be developed during detail design as part of a Construction Environmental Management Plan (CEMP) for implementation in the construction and operation phases. The Project Team continues to seek guidance from regulatory agencies throughout the EA/IA process on project design requirements | Attawapiskat First Nation |
| Comment Theme | How the Comments are Addressed in this Draft EAR/IS | Indigenous Community or Stakeholder |
| and submission requirements for applicable permits, approvals and/or authorizations needed to construct the WSR. With respect to cumulative effects, the Victor Mine is among the projects and activities identified in the federal TISG that was considered in combination with the Project in the cumulative effects assessment (refer to Section 21 of the EAR/IS). The EAR/IS also describe proposed mitigation measures that are technically and economically feasible to eliminate or reduce adverse cumulative effects in Section 7.4 and Appendix E – Mitigation Measures. A summary of the predicted net effects is assessed in Section 7.5, and no significant adverse effects to water quality are anticipated. | ||
| Concerns regarding the ecological consequences of the drainage of peatlands that will result from the construction of the WSR. Members note that peat keeps the water pure. If peat is damaged or destroyed, then water – the source of life – is adversely affected and so is Fort Albany First Nation. | As described in Section 4 (Project Description), approximately 56 km (52% in length of the WSR) in the eastern half of the WSR is located in wetland/muskeg terrain (or peatlands). A “floating” road design will be used for this section of the WSR, which includes the placement of aggregate material (gravel) and use of a geotextile fabric and/or geogrid, similar to the orange plastic construction fencing often seen). A “floating” road is a road that is constructed directly on top of the peat (no peat is removed) and relies on the strength of existing peat for its support. The road does not actually “float” on the peat but rather a balance builds up between the weight of the road and the strength of the peat. The proposed design will support continuous movement of water to ensure that the hydrology characteristics of the peatlands continue to function through the use of a layer of rock or select coarse gravel that permits water flow under and through the road. In addition, the installation of equalization culverts is recommended at frequent intervals to support the continued movement of surface and groundwater/spring water in the peatlands. Where dewatering/drainage is required (e.g., at locations where access to bedrock outcrops is necessary to obtain structural foundation or roadbed material), the potential effects on surface and groundwater quantity, as well as related ecological consequences, including downstream peatland effects, are assessed in Section 7.3 and Section 8.3. | Attawapiskat First Nation Fort Albany First Nation |
| Comment Theme | How the Comments are Addressed in this Draft EAR/IS | Indigenous Community or Stakeholder |
| Surface water and groundwater quality was monitored for seasonal and annual changes during the EA/IA process and monitoring will be included in the Water Management Plan during detail design for implementation in the construction and operation phases. | ||
| Concerns regarding rationale for favourable alternatives in the analysis of alternative corridor concepts with respect to significant wildlife areas for animals hunted by Attawapiskat First Nation, and the importance of the headwaters along this route to downstream communities such as Attawapiskat. | The provincial EA ToR recognizes the potential significance and importance of the road corridor and the adjacent Surface Water Resources VC to Webequie and its immediate neighbours with shared territory and asserted rights in the project area. The ToR also clearly states that other alternatives may be identified and considered, based on additional engagement and consultation, as the EA process moves forward. Within the framework of the Project Team’s integration of Indigenous Knowledge, Section 3 of this Draft EAR/IS – Evaluation of Project Alternatives includes a detailed analysis of the advantages and disadvantages of the WSR alternatives, and the potential significance and importance of the corridor and the Surface Water Resources VC and other VCs to Webequie and its immediate neighbours in selection of the recommended preferred alternatives (e.g., routes, aggregate source areas). | Attawapiskat First Nation |
| Concerns about contamination of headwater streams and rivers by heavy metals including chromium. Commit to the completion of additional seasonal surface water quality sampling during the EA process to determine variability during different seasons and under different flow conditions. It is recommended that sampling be conducted under differing flow regimes (ideally corresponding to 25th, 50th and 75th percentile flow) and provide insight into seasonal variability. | The Project Team recognizes the sensitivity of the headwater wetlands, streams and rivers. As part of the groundwater and surface water baseline information collection and geotechnical investigation completed to date, groundwater monitoring wells (for water level and quality) have been established along the preliminary proposed route for the WSR and in the vicinity of the potential aggregate extraction areas (refer to Section 8.2 – Groundwater and Section 7.2 – Surface Water). To capture seasonal and inter-annual changes, the monitoring and sampling has been conducted in summer and fall of 2020 and continued in 2021 and 2023 for the purposes of informing the EA/IA. Surface water sampling and project effects parameters included: General chemistry and inorganics including:alkalinity;hardness;pH; | Attawapiskat First Nation MECP (Groundwater and Surface water Study Plan) |
| Comment Theme | How the Comments are Addressed in this Draft EAR/IS | Indigenous Community or Stakeholder |
| conductivity;turbidity;total suspended solids;total dissolved solids;cations (i.e., H+, Mg2+, Na+, Ca2+, K+, NH4+);anions (i.e., Cl–, SO42-, F–, NO3-, NO2-, HCO3-, CO32-, PO43-);dissolved organic carbon; andammonia.Metals (total and dissolved): including full metal scan, plus hexavalent chromium and mercury (total mercury and methylmercury);Radionuclides: radium 226;Nutrients: including total organic carbon, total kjeldahl nitrogen and total phosphorus; andOrganic compounds: polycyclic aromatic hydrocarbons (PAHs) and petroleum hydrocarbons (PHCs) including benzene, toluene, ethylbenzene and xylene (BTEX) and PHC F1 to F4. The monitoring and sampling programs are proposed to continue through construction and post- construction periods of the Project to evaluate surface water quality. Best management practices and site-specific mitigation measures as outlined in Appendix E of this EAR/IS will be implemented during construction to minimize the potential impacts to the surface water quality of waterbodies. A summary of the predicted net effects is assessed in Section 7.5, and no significant adverse effects to water quality are anticipated. | ||
| Concerns about “surface water” being one of the environmental components that is being evaluated in isolation, without looking at linkages with other parts of the ecosystem. In the List of Preliminary Evaluation Criteria and Indicators in Appendix B, p. 9 of the ToR, “surface water” is only considered in relation to supporting fish habitat, for navigation, and for human consumption. However, the ToR section on wildlife mentions that changes to hydrology may alter drainage patterns, which will have implications for soils, vegetation, and wildlife. | Laying out the initial evaluation criteria in a discrete, tabular form, as presented in Appendix B of the ToR, is an accepted means for EA practitioners to optimize reader comprehension of the factors and indicators that will used in assessing the project alternatives and their potential effects. The indicators included in the initial set of evaluation criteria are those that represent the most typical and direct effects expected to be associated with implementation of the Project. This does not mean that the criteria will be considered in isolation of each other in conducting the effects assessment. A pathway of effects approach is applied to identify and address related VCs (and related indicators of change) additional to those identified in Appendix B of the ToR as they are | Attawapiskat First Nation |
| Comment Theme | How the Comments are Addressed in this Draft EAR/IS | Indigenous Community or Stakeholder |
| identified and further ecological linkages become more evident. Pathways describe how project activities could result in a potential effect (e.g., dewatering may reduce in-stream discharge resulting in reduced streamflow or water levels in nearby waterbodies) during each project phase (i.e., construction and operations). For an example on a linkage to other VCs, hydrology (e.g., changes to water availability) is a major evaluation criterion during the evaluation of wetland function which forms part of the vegetation effects analysis. | ||
| Concerns regarding whether design criteria for ditches (sized for a 25-year storm return period) and for culverts at watercourse crossings (sized for 100-year storm return period) as stated in the ToR are sufficient to handle potentially more frequent/larger storm returns as a result of climate change. | All roadside ditches will be sized for the 10-year Minor System Design Flow and a minimum 100-year Major System Design Flow in accordance with Ontario Ministry of Transportation (MTO) Drainage Standards. Waterbody crossings (bridges and culverts) will be sized for a minimum 100-year peak flow. The 10-year and 100-year design storms and flows take into account the effects of climate change on precipitation and temperature. In the event of larger storms, design freeboard criteria may be exceeded. Design freeboard includes a factor of safety and exceedance of the freeboard does not necessarily mean that damage would occur. In the event of very large flows greater than the design flow, there could be reduced water crossing clearance, impounding of water upstream of the road alignment, overtopping of the roadway and water crossings, and/or damage to the road structure. As part of the EA/IA, the effects of climate change on the Project are assessed in Section 24 – Effects of the Environment on the Project. The preliminary drainage design criteria for the road, including drainage design with respect to the sizing and type of structures at waterbody crossings are described in Section 4 – Project Description and Appendix D-1 – Preliminary Engineering Design Report. | Attawapiskat First Nation |
| Concerns that the ToR does not identify potential decreases in water levels. Section 7.1.3 of the ToR states “The potential effects to surface water quantity as a result of the identified changes in land cover may include a local increase in runoff rates and runoff volumes at the various project components, and, in turn, an increase | Changes in water levels (increased or decreased) and water quality are assessed in this section (Section 7) of the EAR/IS and mitigation measures are incorporated into engineered structures to minimize and/or avoid adverse potential effects. For crossing structures, mitigation include design with measures such as appropriate sizing of structures (culverts or bridges) to convey flow, and the roadway design include permanent enhanced swales that are | Fort Albany First Nation |
| Comment Theme | How the Comments are Addressed in this Draft EAR/IS | Indigenous Community or Stakeholder |
| in-stream flows, water levels, and erosion- sedimentation processes at nearby waterbodies (i.e., downstream receivers)”. Section 7.1.6 of the ToR identifies potential effects on fish and fish habitat but does not include changes in water levels or mercury mobilization. | designed to convey, treat, and attenuate stormwater runoff from the road. Soil concentrations of total mercury were less than soil quality guidelines at all five water crossings sampled and pose a low risk to water quality. During the occurrence of large erosion and sedimentation events, there is a possibility of mercury mobilizing. However, mitigation measures are incorporated to minimize soil erosion and reduce the likelihood and duration of mercury concentrations exceeding water quality guidelines. | |
| Concerns regarding how upstream and downstream impacts to waterways and fish habitat would be addressed, e.g., ensuring no blockage of access for fish (from Kasabonika Lake First Nation). Concerns that activities on Webequie lands could impact water ways and pollute other communities down stream (from Webequie First Nation). | Section 7 and Section 10 of the EAR/IS assess potential effects to fish habitat and surface water flow and quality in waterways and outline mitigation measures to minimize and/or avoid adverse potential effects. For crossing structures, mitigation include design with measures such as appropriate sizing of structures (culverts or bridges) to convey flow, and embedment of culverts or use of open bottom type culverts to ensure fish passage. As described in Section 4 (Project Description), routine maintenance activities may include removal of obstructions to waterflow at bridge and culvert waterbody crossings where logs, trees, ice or other debris may obstruct flow. As outlined in Section 7.4, Section 10.4, and Appendix E of this EAR/IS, to protect surface water quality, proposed mitigation measures include procedures and practices for implementation to prevent the release of contaminants (petroleum or chemical products) resulting from improper management and maintenance of equipment (e.g., leaks), or accidental spills from vehicles and equipment used during the construction and operations of the WSR. | Kasabonika Lake First Nation Webequie First Nation |
| Comment Theme | How the Comments are Addressed in this Draft EAR/IS | Indigenous Community or Stakeholder |
| Concerns whether the proponent possess the financial and technical capacity to protect the fish, wildlife and water resources that will be impacted by the Project. | The assessment of the financial feasibility of the proposed WSR is not part of the scope of the EA/IA. The party(ies) responsible for designing, constructing and operating the WSR will be required to demonstrate the financial and technical experience and capacity to successfully fulfill all environmental commitments made in the EA/IA phase, as well as the conditions of any permits, licences, approvals and authorizations obtained to implement the Project. | Neskantaga First Nation |
| Question regarding what detection limits are used for mercury in surface water. | As described in Section 7.2, both mercury and methylmercury were tested for surface water samples. The detection limit is 0.000005 mg/L, or 0.005 µg/L for total mercury; and 0.00002 µg/L for total methylmercury. These limits are low enough to detect exceedances of the CCME guidelines for protection of the aquatic life which are 0.026 µg/L for total and 0.004 µg/L (interim guideline) for total methylmercury. | Neskantaga First Nation |
| Concerns regarding how hydrological changes to peatlands and discharges of total methylmercury in downstream wetlands and surface waters are measured and modelled. | Baseline (pre-construction) surface water and sediment qualities, including mercury and methylmercury, among other parameters, were tested, at the majority of the water crossings, in different events to capture seasonal variations. The testing showed that baseline mercury concentrations were below the CCME guidelines at all the sampled locations. During construction and operation phases of the Project, these parameters are proposed to be tested again at up and downstream locations. The results will be compared with the baseline conditions to evaluate potential changes in surface water quality. | Neskantaga First Nation |
| Concerns regarding how the proponent plans to test the proposed fill materials needed to build and operate the road for mercury, and other contaminants, during the EA/IA process. | Geochemical field investigations, including soil and rock sampling, have been conducted at various sites, including quarries, rock cuts, and talus locations where materials might be generated or stockpiled to support the EA/IA process and are described in detail in the Natural Environment Existing Conditions (NEEC) Report (Appendix F of the EAR/IS). This field program was in addition to the surface and groundwater sampling program for chemical analysis, including mercury determinations. The main objective of the geochemical sampling and testing program on soils and rocks was to provide an indication of the potential for metal leaching (ML) and acid rock drainage (ARD) at quarries, rock cuts and talus sites, as well as locations where materials are generated and stockpiled. | Neskantaga First Nation |
| Comment Theme | How the Comments are Addressed in this Draft EAR/IS | Indigenous Community or Stakeholder |
| Samples were subject to acid-base accounting (ABA) [paste pH, total sulphur, sulphide sulphur, HCl leachable sulphate, carbonate leach sulphate, modified Sobek Neutralization-Potential, total carbon and inorganic carbon] and Synthetic Precipitation Leaching Procedure (SPLP) with an extraction fluid at pH 4.2 [with ICP-MS analysis for major cations (Ca, Mg, K, Na) and 28 metals and metalloids]. The purpose of testing was: ABA – to provide an indication of the acid-base accounting characteristics of the soil and bedrock materials and associated insights on potential generation of net-acidity; andSPLP – to provide a preliminary indication of leachable loadings upon contact with moderately acidic water (i.e., pH 4.2). Both sampling and geochemical test work methods were informed by industry best practice in relation to the assessment of ARD-ML generally, and specifically for road works projects. Overall, the ABA and SPLP testing suggests both the bedrock and soil samples have a relatively low potential for ARD-ML; however, during the detail design stage and construction planning, certain geochemical considerations for fill materials will be addressed as material source/storage/placement locations and project development details become available. | ||
| Concerns regarding how fugitive dust impacts from surface runoff from bridges would be addressed. | This potential impact will be addressed using typical best management practices to supress dust such as application of water via tanker truck and use of erosion and sediment control measures (e.g., erosion control blankets on newly graded soil embankments; check dams in drainage ditches/channels). Appendix E (Mitigation Measures) of this EAR/IS outlines measures to control fugitive dust impacts. The potential impact of runoff from bridges will be addressed through stormwater management designs. Conduits to direct stormwater runoff for treatment, such as stormwater management ponds, will be incorporated into the road design if deemed necessary to minimize the impacts to water quality in watercourses. | Neskantaga First Nation |
| Comment Theme | How the Comments are Addressed in this Draft EAR/IS | Indigenous Community or Stakeholder |
| Concerns about “Degradation of/alteration to surface water quality and flow, and/or fish habitat” as well as the mitigation measures related to water taking and dewatering in the ToR (Project Effects on Natural Environment). | Potential effects of the Project on surface water and fish and fish habitat are assessed in the following sections of the EAR/IS. Section 7 (Assessment of Effects on Surface Water Resources); andSection 10 (Assessment of Effects on Fish and Fish Habitat). Mitigation measures related to water taking and dewatering are outlined in Section 7.4, Section 8.4, Section 10.4, and Appendix E of this EAR/IS. | MECP |
| Provided comments regarding decommissioning of cross over navigable waterways. | Section 7.4.4 outlines information regarding permanent waterbody crossings structures. Also, Section 5.21 (Site Decommissioning and Rehabilitation) of Appendix E (Mitigation Measures) describes mitigation measures to prevent or limit the effect of construction and operation phases on water quantity. | Transport Canada |
7.1.3 Incorporation of Indigenous Knowledge and Land and Resource Use Information
To date, the following First Nations have provided Indigenous Knowledge and Land and Resource Use (IKLRU) information to the Project Team:
- Webequie First Nation;
- Marten Falls First Nation; and
- Weenusk First Nation.
Table 7-3 summarizes IKLRU information relating to Surface Water Resources VC and indicates where the information is incorporated in the EAR/IS.
Table 7-3: Surface Water Resources VC – Summary of Indigenous Knowledge and Land and Resource Use Information
| Common Theme | Key Information and Concerns | Response and/or Relevant EAR/IS Section |
| Water quality and quantity (surface and/or groundwater) | Information Shared Contamination to the water could potentially impact how the waters freeze in the winter’s cold.Many sites have already abandoned materials such as fuel drums, which can cause leaking into the water and onto the lands. | The potential effects of accidental spills are assessed in Section 23 – Accidents and Malfunctions. Consequences of these potential accidents and malfunctions incidents associated with surface water are evaluated using a risk-based assessment by examining the likelihood of an incident and the |
| Common Theme | Key Information and Concerns | Response and/or Relevant EAR/IS Section |
| Future contamination of the water in and outside of traditional areas of Indigenous communities.“No safe distance would exist from contamination related to future development”.Due to the connectivity between the water and the surrounding wildlife and vegetation, water quality and quantity was identified as important for community health.Recommendation that no dams be built in conjunction with road development due to repetitive negative experiences with dams drying up waterways and flooding lands, ultimately altering wildlife habitats, migration routes and more. Concerns Concerns regarding the risk of spills affecting pristine lakes and land, and impacts on water quality in nearby water systems, rivers and lakes.It was noted that the rivers have always been highways for those that belong to these traditional territories. Concerns regarding the negative impacts of the road development which may re-route the same river systems they have been using for hundreds of years.Concerns about potential river system damage and rerouting due to spills during development.Concerns were shared surrounding the short and long -term effects of contamination to water, humans and land, changes to flow patterns, and the impacts of their traditional livelihoods; like trapping and hunting, for future generations.Heightened levels of concern about the developments in and around the Ring of Fire and emphasized the importance of protecting the watershed for future generations.It was noted that the introduction of water systems on -reserve has had negative impacts on community members. The community’s water treatment facility, | potential consequences of the incident to relevant VCs and Indigenous interests (Section 23.3). Table 23-3 in this section identifies potential hazards and outlines associated mitigation measures. Potential project effects on surface water resources are assessed in this EAR/IS section (Section 7) and Section 21 (Cumulative Effects Assessment). Table 7-14 summarizes the potential effects, mitigation measures, and predicted net effects for Surface Water Resources VC.Appendix E of the EAR/IS outlined mitigation measures to eliminate or reduce potential adverse effects of the Project. These mitigation measures reflect environmental protection guidelines to protect “Environmentally Sensitive Areas” as described in the Webequie First Nation On-Reserve Land Use Plan (Webequie First Nation, 2019a). Further measures will be provided in the CEMP and the Operation Environmental Management Plan (OEMP) that will be developed for the Project. Section 4.6 of the EAR/IS describes the proposed framework for the development of the CEMP and the OEMP.Proposed water quality monitoring program is outlined in Section 7.10, Section 22, and in Section 5.22 (Water Quality Monitoring) of Appendix E – Mitigation Measures.Best practices for controlling dust are outlined in Section 5.18 (Dust Control Practices) of Appendix E – Mitigation Measures.As noted in Section 4 (Project Description), planned water crossings (rivers or waterbodies) will be designed not to change the downstream hydrology and prevent the roadway from acting as a dam by impounding water. Where the road passes through low- lying areas and has the potential to |
| Common Theme | Key Information and Concerns | Response and/or Relevant EAR/IS Section |
| though upgraded in 2019, remains non- operational due to restricted resources. This has led to long-term boil water advisory, requiring community members to rely on bottled water that needs to be flown in and is expensive. Concerns about the rise of pollution as projects develop, from water contamination, noise pollution, industrial dust, contaminants in nearby waterways and groundwater and littering.Concern about the impact of dust from increased traffic on water, wildlife, and the environment and about the inability to contain the dust and its negative effects of ecosystems and wildlife.Concerns of how dust will be managed so that it does not negatively impact the local animals like sturgeon because they are sensitive to environment changes.Concerns regarding the illegal dumping of waste which can negatively impact the health and safety of their people, especially if waste leaches into the water table.Concerns regarding long-term effects of past projects with dams and diversions resulting in significantly reduced water levels in the Albany River, thereby changing wildlife habitat and how Indigenous community members use the river.Concerns about potential changes to flow patterns and how this would adversely impact future generations. A notable consequence of this is reduced river depths resulting in more shallow areas and more difficult boat navigation.“The river is like a vein; a bloodline. And if that’s ruined, then it slowly dies. Same thing with the animals around us that we live off.”It was noted that major floods in the past (e.g., in 1957, 1966, and 1986) led to relocation of a community to avoid future flooding. | change the local hydrology, mitigation measures including, but not limited to, equalization culverts, drainage blankets and/or subdrains will be placed to minimize or eliminate any such changes. |
| Common Theme | Key Information and Concerns | Response and/or Relevant EAR/IS Section |
| Current state of environment and connectedness of water to cultural and spiritual necessity, livelihood, Indigenous way of life, land, wildlife, fish, plants and herbs. | Information Shared The land right now is unique, untouched and natural, with no current contaminations or major impacts. It is preserved and safe, allowing for natural activities like drinking directly from the water and living off the land.For Indigenous Peoples, water is the most precious element in their livelihood, cultural beliefs and traditional practices. Water heals, provides life, provides sustenance, and provides natural medicines. To Indigenous Peoples, healthy rivers and lakes are not only a cultural and spiritual necessity, they also contribute to their entire way of life, including how they travel.According to oral history and new age data, the Winisk River is connected to a series of maze-like channels that lead to and from other rivers, creating an intricate connection between all of its habitat.Elders teach that the Creator placed the people on this land and provided them with everything they need to lead a good life; the creator gives the ability to thrive as a people and the responsibility to respect and care for all creation.Several waterways in the Winisk River Watershed are habitat for medicinal plants and herbs. Concerns The connection between water, wildlife, vegetation, and water quality and quantity are crucial for members’ health. While members’ traditional territories are generally seen as “pristine” and “safe”, some members of the area, including Elders, have noticed changes over their lifetime. The water, once clear and fast, has become murky and shallow, making navigation difficult and unpredictable. | Potential project effects on surface water resources are assessed in this EAR/IS section (Section 7) and Section 21 (Cumulative Effects Assessment). Potential project effects on other valued components (VCs), including Land and Resource Use VC and Aboriginal and Treaty Rights and Interests VC are assessed in Sections 6, 7, and 9 to 21.Appendix E of the EAR/IS outlined mitigation measures to eliminate or reduce potential adverse effects of the Project. These mitigation measures reflect environmental protection guidelines to protect “Environmentally Sensitive Areas” as described in the Webequie First Nation On-Reserve Land Use Plan (Webequie First Nation, 2019a). Further measures will be provided in the CEMP and the OEMP that will be developed for the Project. Section 4.6 of the EAR/IS describes the proposed framework for the development of the CEMP and the OEMP.The recommended monitoring program related to the Surface Water Resources VC is outlined in Section 7.10. Monitoring program will conduct inspections by qualified personnel to report on the effectiveness of procedures and mitigation measures. The data collected will be used to evaluate the effectiveness of mitigation measures which will allow for adaptive management of practices for the Project and future environmental activities. Additional details on monitoring programs for the Project are described in Section 22 of this EAR/IS, Follow-up and Monitoring Programs. |
| Common Theme | Key Information and Concerns | Response and/or Relevant EAR/IS Section |
| Monitoring | Information Shared Community members suggested water monitoring and fish monitoring programs to test contaminant levels in the water and wildlife and requested to be involved in the planning and execution of these monitoring programs.Rather than a one-time assessment on animals and environment, community members want the next 100 years to be monitored.Water is deeply spiritual for community members, essential for life, ceremonies, and travel. Protecting rivers and water bodies is a community responsibility. Important waterways include the Winisk River, its channels, and the upper Ekwan and Lower Attawapiskat watersheds flowing to James Bay. Concerns Concerns regarding keep water clean for next generations.Concerns about water quality are significant, impacting both people and wildlife. Over the past 60 years, the community has noticed a decline in water quality. In the past, water from any source was drinkable, highlighting the changes observed over time.Upper Ekwan and Lower Attawapiskat tertiary watersheds flow into James Bay. Watershed flow and function, including maintaining healthy water systems and the life that they support is a critical objective of community land use planning. | The recommended monitoring program related to the Surface Water Resources VC is outlined in Section 7.10. Monitoring program will conduct inspections by qualified personnel to report on the effectiveness of procedures and mitigation measures. The data collected will be used to evaluate the effectiveness of mitigation measures which will allow for adaptive management of practices for the Project and future environmental activities. Additional details on monitoring programs for the Project are described in Section 22 of this EAR/IS, Follow-up and Monitoring Programs. |
Notes: Names of First Nations and associated location-specific description in some instances are not presented in this table due to potential sensitivity and confidentiality of IKLRU information.
7.1.4 Valued Component and Indicators
Valued components, including surface water resources, have been identified in the TISG and by the Project Team and are, in part, based on what Indigenous communities and groups, the public, government agencies, and stakeholders have identified as valuable to them in the EA/IA process to date. Subcomponents (or criteria) of the Surface Water Resources VC are further identified to help inform the report structure and better assess and present the data and assessment results. The assessment of these subcomponents is being conducted using the methodology as outlined in
Section 5 (Environmental Assessment / Impact Assessment Approach and Methods). The identified subcomponents for the Surface Water Resources VC are:
- Surface water quantity;
- Surface water quality; and
- Sediment quality at waterbodies.
“Indicators”, are used to assess potential effects to a VC. In general, indicators represent a resource, feature or issue related to a VC that if changed from the existing conditions may demonstrate a positive or negative effect.
Table 7-4 shows the subcomponents and indicators identified for the Surface Water Resources VC.
Table 7-4: Surface Water Resources VC – Subcomponents, Indicators, and Rationale
| Subcomponent(s) | Indicators | Rationale |
| Surface water quantity | Stream discharge (variety of flow conditions including mean annual, monthly, and event based-discharges);Channel hydraulics (flow depth/water level and velocity);Erosion and sedimentation; andOverland runoff drainage patterns. | Project activities and/or components have potential for short-term and long-term effect on surface water quantity.Importance to supporting fish, recreational use, navigation of watercraft.From IKLRU information, surface water resources are considered an important element in the livelihood, cultural beliefs and traditional practices of Indigenous Peoples. |
| Surface water quality | Concentration of suspended solids;Concentration of chemical constituents; andErosion and sedimentation. | Project activities can cause changes to water quality, which may affect fish/fish habitat and aquatic organisms.The ability to access and use clean drinking water is fundamental to the health and well of Indigenous communities.Importance of assessing potential changes to water quality was identified through feedback received from Indigenous communities, the public, government agencies, and stakeholders.Indigenous Peoples recognize the sacredness of water, the interconnectedness to all life and the importance of protecting water from pollution.Importance to human use (drinking water or other consumption). |
| Sediment quality | Concentration of suspended solids;Concentration of chemical constituents; andErosion and sedimentation. | Project activities will result in physical or chemical changes to sediment in waterways could potentially result in changes to water quality that may in turn affect fish/fish habitat and aquatic organisms. |
7.1.5 Spatial and Temporal Boundaries
The following assessment boundaries have been defined for the Surface Water Resources VC.
7.1.5.1 Spatial Boundaries
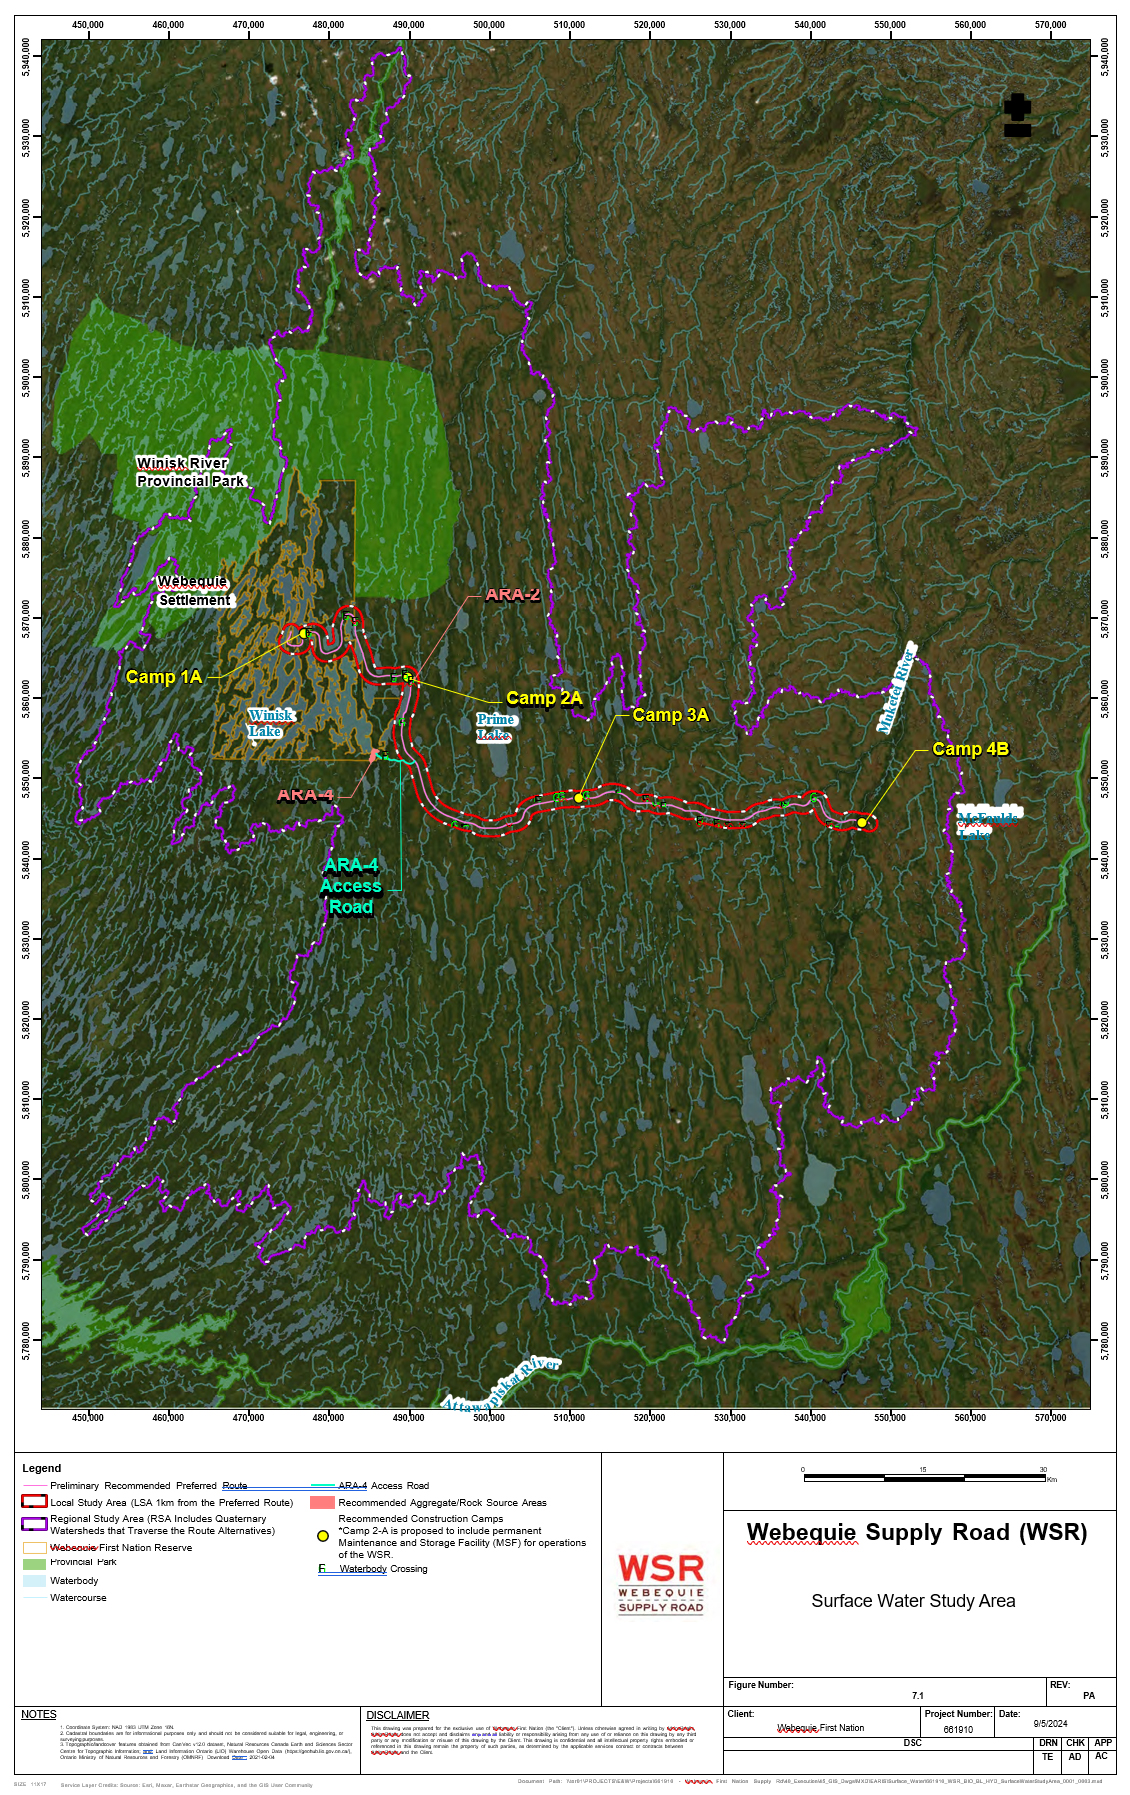
The spatial boundaries for the Surface Water Resources VC are shown on Figure 7.1 and include the following:
- Project Footprint – the area of direct disturbance (i.e., the physical area required for project construction and operations). The Project Footprint is defined as the 35 m wide right-of-way (ROW) of the WSR; and temporary or permanent areas needed to support the Project that include access roads, construction camps, laydown and storage yards, aggregate pits/quarries, and a Maintenance and Storage Facility.
- Local Study Area (LSA) – the area where potential largely direct, and indirect effects of the Project are likely to occur and can be predicted or measured for assessment. The LSA extends approximately 1 km from the centreline of the preliminary recommended preferred route and 500 m from the boundary of the temporary and permanent supportive infrastructure.
- Regional Study Area (RSA) – the area where potential largely indirect and cumulative effects of the Project in the broader, regional context may occur. The RSA includes the LSA and further extends on each side of the LSA boundaries to include quaternary watersheds crossed by the recommended preferred route.
7.1.5.2 Temporal Boundaries
Temporal boundaries for the assessment address the potential effects of the Project over relevant timescales. The temporal boundaries for the Project consist of two main phases:
- Construction Phase: All activities associated with the initial development of the road and supportive infrastructure from the start of construction to the start of operation and maintenance of the Project and is estimated to be approximately 5 to 6 years in duration; and
- Operations Phase: All activities associated with operation and maintenance of the road and permanent supportive infrastructure (e.g., operations and maintenance yard, aggregate extraction and processing areas) that will start after construction activities are complete, including site restoration and decommissioning of temporary infrastructure (e.g., construction camps). The Operations Phase of the Project is anticipated to be 75 years based on the expected timeline for when major refurbishment of road components (e.g., bridges) is deemed necessary.
The Project is proposed to be operated for an indeterminate period; therefore, future suspension, decommissioning, and eventual abandonment is not evaluated in the EA/IA (refer to Project Description, Section 4.4).
7.1.6 Identification of Project Interactions with Surface Water Resources
Table 7-5 identifies the project activities that may interact with the Surface Water Resources VC to result in a potential effect. The identification of project interactions with surface water resources provides a basis for the subsequent assessment of the potential effects of the Project. The potential effects are described separately for subcomponents of Surface Water Resources VC including surface water quantity, surface water quality, and sediment quality.
Table 7-5: Project Interactions with Surface Water Resources VC and Potential Effects
| Project Activities | Potential Effects | ||
| Change in Surface Water Quantity | Change in Surface Water Quality | Change in Sediment Quality | |
| Construction | |||
| Mobilization of Equipment and Supplies: Transport of equipment, materials and supplies to the Project site area using the winter road network and airport in the Webequie First Nation Reserve. | – | ✓ | ✓ |
| Surveying: Ground surveys are conducted to stake (physically delineate) the road right-of-way (ROW) and supportive infrastructure components of the Project (i.e., construction camps, access roads, laydown/storage areas, and aggregate extraction and processing areas). | – | – | – |
| Vegetation Clearing and Grubbing: Clearing and grubbing of vegetation (forest & wetland), including removal, disposal and/or chipping. | ✓ | ✓ | ✓ |
| Construction and Use of Supportive Infrastructure: This includes temporary construction camps, access roads and watercourse crossings, laydown/storage areas, and aggregate extraction (pits & quarries) and processing areas (screening, crushing), including blasting. | ✓ | ✓ | ✓ |
| Construction of Road: removal and stockpiling of organics, subgrade excavation, placement of fill and gravel, grading and drainage work (e.g., road ditches, erosion protection, etc.). | ✓ | ✓ | ✓ |
| Construction of Structures at Waterbody Crossings: Culverts and bridges – foundations (e.g., pile driving and concrete works), bridge girders, bridge decks, install of culverts. | ✓ | ✓ | ✓ |
| Decommissioning / Closure of Temporary Aggregate Extraction and Processing Areas (pits and quarries): Demobilization of extracting and processing equipment, grading and site reclamation/revegetation. This also includes formalizing / re-purposing select pits and quarries proposed as permanent Project components during operations. | ✓ | ✓ | ✓ |
| Decommissioning of Temporary Construction Camps, Access Roads and Laydown / Storage Areas: Grading and site reclamation/revegetation. This also includes formalizing / re-purposing select access roads to permanent pits and quarries and a construction camp to an operations and maintenance facility as Project components for use during operations. | ✓ | ✓ | ✓ |
| Project Activities | Potential Effects | ||
| Change in Surface Water Quantity | Change in Surface Water Quality | Change in Sediment Quality | |
| Emissions, Discharges and Wastes1: Noise, air emissions / GHGs, water discharge, and hazardous and non-hazardous wastes. | ✓ | ✓ | ✓ |
| Completion of Project-Wide Clean-up, Site Restoration / Reclamation and Demobilization: Clean-up of excess materials, site revegetation and demobilization of equipment and materials. | ✓ | ✓ | ✓ |
| Potential for Accidents and Malfunctions2: Spills, vehicle collisions, flooding, forest fire and vandalism. | – | ✓ | ✓ |
| Employment and Expenditures3 | – | – | – |
| Operations | |||
| Road Use: Light and heavy vehicles and maintenance equipment with average annual daily traffic volume of less than 500 vehicles. | – | ✓ | ✓ |
| Operation, Maintenance and Repair of Road: Includes: vegetation management control within road ROW; repairs/resurfacing of road granular surface and shoulders; dust control; winter/seasonal maintenance (e.g., snow clearing); road drainage system cleanout/repairs to culverts, ditches and drainage outfalls; rehabilitation and repairs to structural culverts and bridges; and road patrols for inspection. | ✓ | ✓ | ✓ |
| Operation of Pits, Quarries, and Maintenance Yard/Facility: Includes periodic extraction and blasting and processing operations (i.e., crushing, screening) and stockpiling of rock and aggregate materials. Also includes operation and repairs of Maintenance Yard/Facility and components within (office buildings, parking, storage of equipment and materials). | ✓ | ✓ | ✓ |
| Emissions, Discharges, and Wastes1: Noise, air emissions / GHGs, water discharge, and hazardous and non-hazardous wastes. | ✓ | ✓ | ✓ |
| Potential for Accidents and Malfunctions2: Spills, vehicle collisions, forest fire and vandalism. | – | ✓ | ✓ |
| Employment and Expenditures3 | – | – | – |
Notes:
✓ = Potential interaction – = No interaction
1 Emissions, Discharges, and Wastes (e.g., air, noise, light, solid wastes, and liquid effluents) are generated by many project activities. Rather than acknowledging this by placing a checkmark against each of these activities, “Wastes and Emissions” is an additional component under each project phase.
2 Accidents and Malfunctions including spills, vehicle collisions, flooding, forest fire and vandalism may occur at any time during construction and operations of the Project. Rather than acknowledging this by placing a checkmark against each of these activities, “Potential for Accidents and Malfunctions” is an additional component under each project phase. The potential effects of accidental spills are assessed in Section 23 – Accidents and Malfunctions.
3 Project employment and expenditures are generated by most project activities and components and are the main drivers of many socio-economic effects. Rather than acknowledging this by placing a checkmark against each of these activities, “Employment and Expenditures” is an additional component under each project phase.
7.2 Existing Conditions
This section summarizes the existing conditions of surface water and sediment based on desktop review and field investigations conducted for the Project. Limited existing surface water and sediment quality data were available in RSA for the Project due to the remote location and limited development. Relevant environmental studies in the region have been completed by the Ontario Ministry of the Environment and Climate Change, resource development companies, and other governmental and non-governmental organizations. However, these studies were not completed near the project location and do not provide sufficient data to establish baseline surface water quality conditions in the RSA. As such, it was necessary to collect project-specific surface water and sediment quality data.
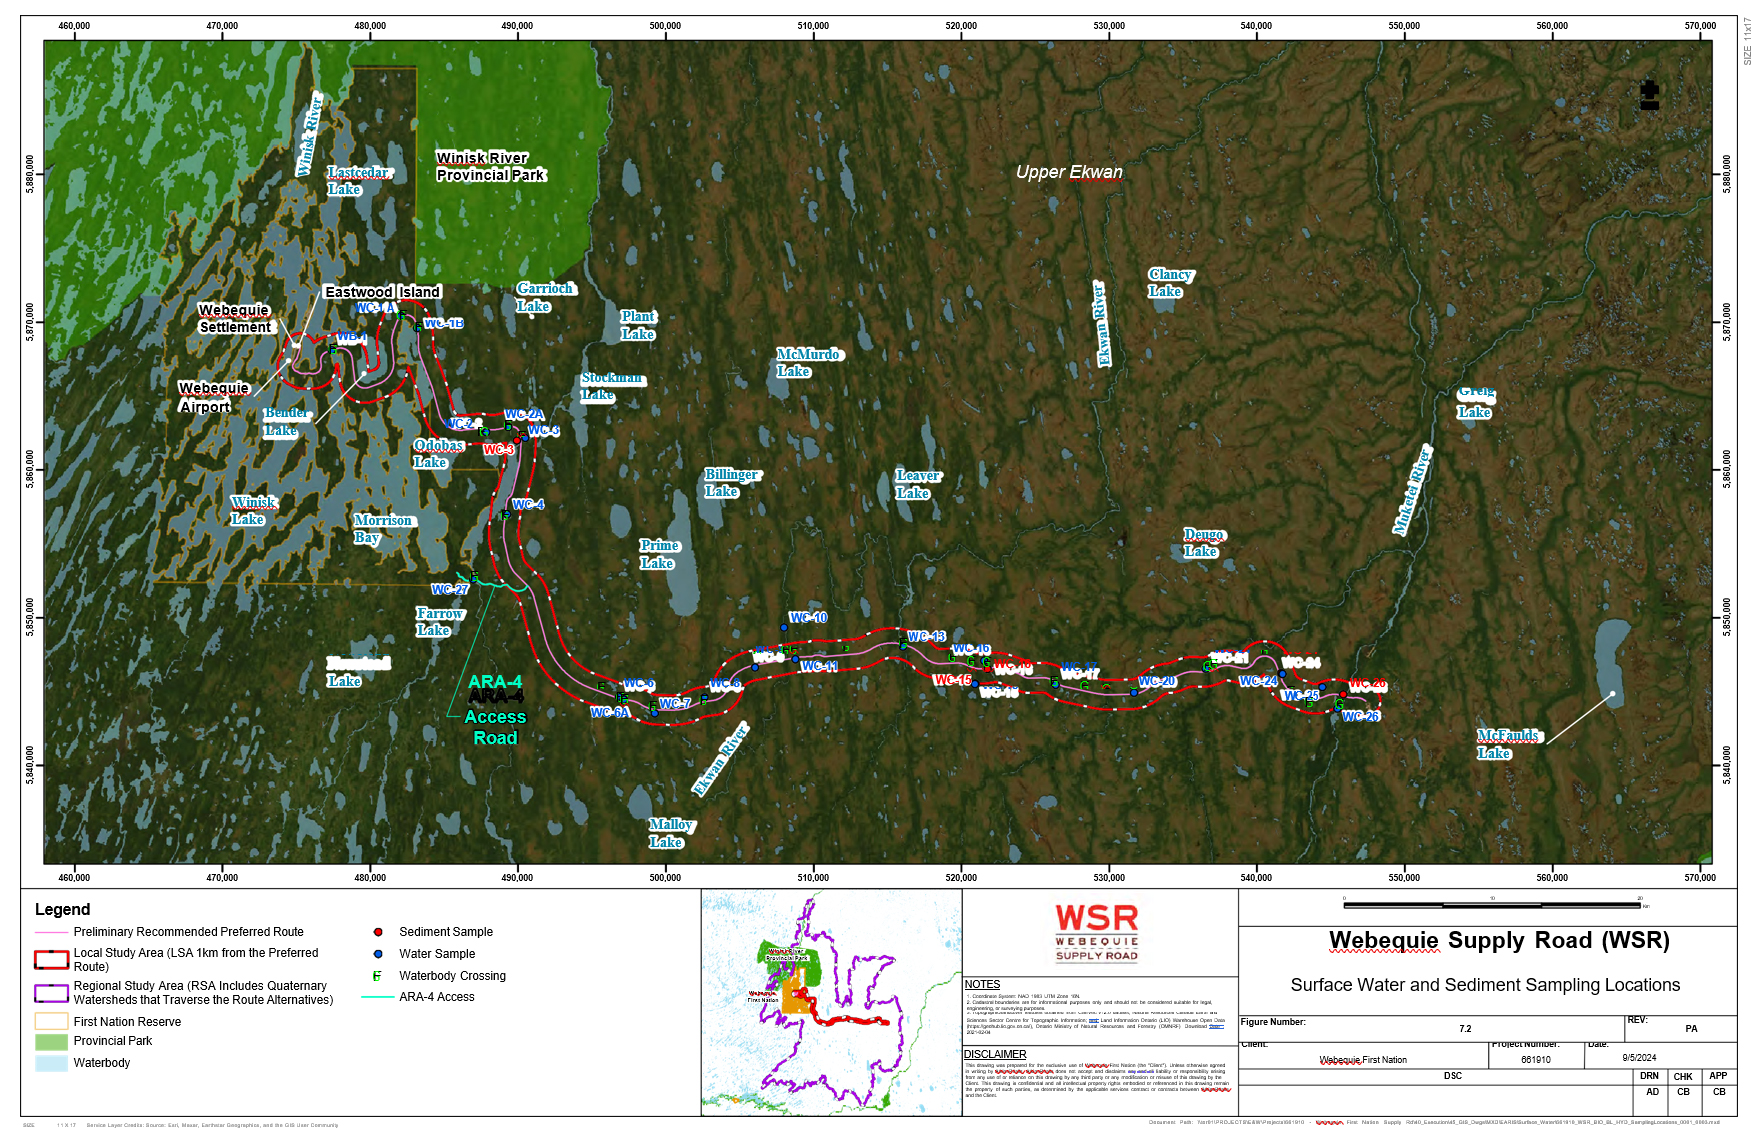
Baseline surface water and sediment quality sampling was conducted to establish existing surface water and sediment quality conditions at waterbody and watercourse crossings within the LSA and along the route of the proposed WSR. The waterbody crossing locations along the route of the proposed WSR are shown in Figure 7.2. A hydrology and hydraulic analysis were conducted to establish peak discharge estimates (e.g., design flow) and hydraulic characteristics of peak discharges under existing conditions. Detailed description of existing surface water and sediment conditions is provided in Appendix F – NEEC Report.
7.2.1 Methods
This section summarizes methods used to characterize the existing surface water and sediment conditions. The methods included a desktop review of background information sources, field surveys to establish approximate channel bathymetry, surface water quality and sediment quality, and hydrological analysis, with the objective of addressing the requirements in Sections 8.6 and 14.2 of the TISG and meeting the requirements of the MECP and other provincial ministries as identified in the ToR for the Project. The NEEC Report prepared for the Project (Appendix F) includes a detailed description of the methods and results of the desktop review, field surveys, and hydrological analysis.

Indigenous community members raised concerns about heavy metals including chromium, being introduced to the project area during construction and operations. To address this, strict regulatory guidelines were followed during the groundwater baseline investigation program concerning heavy metals including chromium, mercury and methylmercury. The study also included total metal and dissolved metal concent
7.2.1.1 Desktop Review of Background Information
The following background information sources were reviewed to characterize existing surface water conditions for the Project.
- Regional hydrology data obtained from the historic Ontario Flow Assessment Tool (MNR, 2019), re-launched in 2022 as Ontario Watershed Information Tool Ministry of Natural Resources (MNR);
- Google Earth Satellite Imagery;
- Field notes from site geotechnical and biological investigations reconnaissance;
- Light detection and ranging (LiDAR) data collected for the Project;
- Environment Canada, Water Survey of Canada Monitoring Stations; and
- Ring of Fire Baseline Environmental Monitoring Program (Preliminary Report; MECP, 2019).
Existing surface water yield and surface water quality conditions were determined by review and analysis of information extracted from the Ontario Watershed Information Tool (OWIT; previously Ontario Flow Assessment Tool [OFAT]) and atlases, as well data available from the Water Survey of Canada and Provincial Water Quality Monitoring Network.
7.2.1.2 Surface Water Quantity
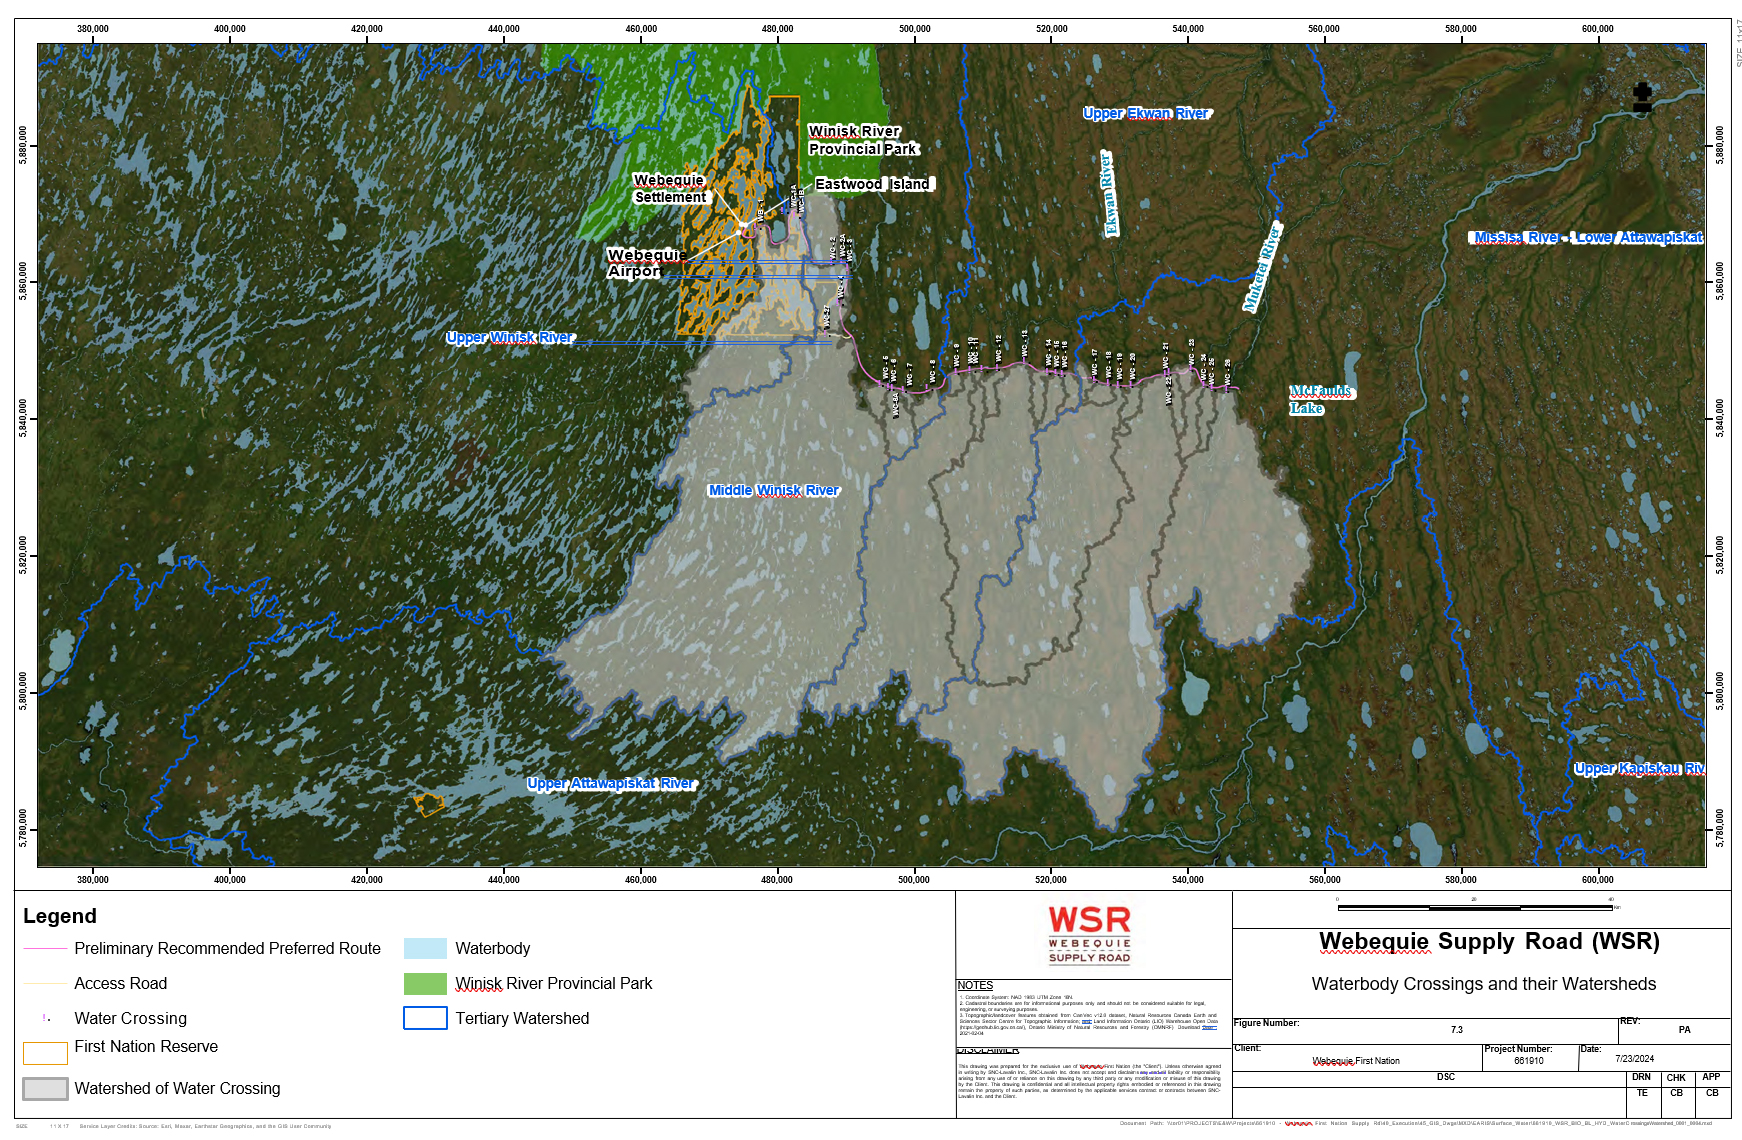
Twenty-six potential waterbody crossings (watercourse/waterbody) were initially identified prior to the field studies from 2019 through 2021. In 2023, an additional large waterbody crossing (WC-27) was added along the access road to an aggregate source area (ARA-4). Four additional small waterbody crossings, with catchment areas less than 1.5 km2, were also identified along the proposed WSR route. These small crossings were labelled with the number of the waterbody crossing to the west with an additional sequential letter (WC-1A, WC-1B, WC-2A, and WC-6A). A field study was conducted in 2023 to collect data at the additional five waterbody crossings. Data collected relevant to surface water quantity included:
- Waterbody type;
- Flow estimates;
- Mean wetted depth;
- Mean wetted width;
- Mean bankfull width;
- Substrate;
- Beaver dam presence;
- Riparian vegetation;
- Floodplain characteristics; and
- Ground photography.
- Flow estimates;
The waterbody crossings are described in detail in Section 5 of the NEEC Report (Appendix F). These crossings were noted as having a defined channel/flow path and do not include wetlands or areas that may experience ephemeral flow for a short duration after a precipitation event in a given year. The OWIT, developed by the Ontario MNRF (now MNR) was utilized to calculate watershed characteristics. The waterbody crossing locations of the proposed WSR route are shown in Figure 7.3.
The method of establishing the peak discharge for each waterbody crossing depends on several factors such as available data, crossing location, and watershed catchment size. Section 5.2.4 in the NEEC Report (Appendix F) and Section 3.1 and Figure 2.1 in the Hydrologic and Hydraulic Analysis for the Webequie First Nation Supply Road Memo (Appendix 5-A of the NEEC Report) outline the general approach to identifying the methods to follow when developing a design flow for roads. It should be noted that the proposed crossings are on waterbodies that are not gauged
(i.e., no flow records).
The methods considered to establish peak discharges at proposed watercourse crossing with larger catchments were the Index Flood Method (from OFAT), Modified Index Flood Method, the Transposition of Flood Discharge Method (using single station), the Transposition of Flood Discharge Method (using Regional Flow Frequency Analysis), Northern Ontario Hydrology Method, and Unified Ontario Flood Method. Rational Method was used to establish peak discharges for smaller catchments. Note that the discharge estimate feature in OFAT is no longer available in OWIT.
The existing hydraulics (flow depth/water level and average velocity) and High-Water Level for each of the waterbody crossings were subsequently estimated using 1-dimensional hydraulic models. The 1-dimensional model uses known values or estimates of waterbody geometry and channel roughness (Manning’s ‘n’) to predict flow depth and velocity for a range of discharge conditions. Geometry was generated from LiDAR data (where available) or Canadian Digital Elevation Model data and field estimates for channel size (depth/width). A high degree of estimation was required to model each waterbody crossing due to data availability. For instance, Manning’s ‘n’ values and channel side slopes were estimated from photographs of the water crossings. Channel slope and overbank topography was estimated from LiDAR data and channel shape was estimated from field observations. Further details for these methods are described in detail in Section 5.2.4 in the NEEC Report (Appendix F).
7.2.1.3 Surface Water Quality
The water quality sampling was conducted during the baseline aquatic field work program in August 2019,
October 2020, May 2021, and August 2023. Sampling collection methods, QA/QC protocols, and application of relevant water quality guidelines are described in detail in Section 5 of the NEEC Report (Appendix F).
Indigenous community members raised concerns about potential contamination of the headwaters and rivers by heavy metals including chromium. Methylmercury and other water quality concerns (parameters) have been included in the surface water baseline investigation program. Surface water quality was monitored for seasonal and annual changes during the EA/IA process. A Surface Water and Storm Water Management and Monitoring Plan will be developed during detail design as part of the Construction Environmental Management Plan (CEMP) and the Operation Environmental Management Plan (OEMP) for implementation in the construction and operation phases. The Project Team continues to seek guidance from regulatory agencies throughout the EA/IA process on project design requirements and submission requirements for applicable permits, approvals and/or authorizations needed to construct the WSR.
Field measurements of pH, and temperature were recorded during the sampling event using a multi-parameter probe YSI Proplus meter. Turbidity water samples were collected and put into a Lamotte 2020WE turbidity meter. The probe and meter were calibrated prior to each sampling and re-calibrated daily or as required according to the operating manual for the instrument. Water quality data were collected from 24 sampling stations along the proposed WSR route. The locations of these stations were the same as aquatic assessment locations/stations (refer to Section 8 of the NEEC Report [Appendix F]) and are listed by watershed in Table 7-6 and shown in Figure 7.2.
Table 7-6: Water Quality Sampling Sites
| Watershed | Sampling Sites (Waterbody Crossings) |
| Winisk River | 2019: WB-1, WC-2, WC-3, WC-4, WC-6, WC-7, WC-8 (7) 2020: WB-1, WC-2, WC-3, WC-4, WC-6, WC-7, WC-8 (7) 2021: WB-1, WC-2, WC-3, WC-4, WC-6, WC-8 (6) 2023: WC-1A, WC-1B, WC-2A, WC-6A, WC-27 (5) |
| Ekwan River | 2019: WC-9, WC-10, WC-11, WC-13, WC-15, WC-16 (6) 2020: WC-10, WC-11, WC-13, WC-15, WC-16 (5) 2021: WC-10, WC-11, WC-13, WC-15, WC-16 (5) |
| Attawapiskat River | 2019: WC-17, WC-20, WC-21, WC-24, WC-25, WC-26 (6) 2020: WC-17, WC-20, WC-21, WC-24, WC-25, WC-26 (6) 2021: WC-17, WC-20, WC-21, WC-24, WC-25, WC-26 (6) |
Standard surface water quality parameters were measured in all samples collected. The samples were analyzed for the parameters listed in Table 7-7 during the years indicated with a checkmark. Detailed analysis results are provided in the NEEC Report (Appendix F).
Table 7-7: Surface Water Quality – Summary of Field Measuring and Laboratory Analytical Parameters Collected in 2019, 2020, 2021, and 2023
| Parameter Category | Analytes | 2019 | 2020 and 2021 | 2023 |
| In-Situ/Field | pH, Temperature | ✓ | ✓ | ✓ |
| General Chemistry | Electrical Conductivity, Hardness, pH, Total Dissolved Solids (TDS), Total Suspended Solids, Turbidity | ✓ | ✓ | ✓ |
| Inorganics and Nutrients | Total Alkalinity, Ammonia Nitrogen, Unionized Ammonia, Bicarbonate, Bromide, Carbonate, Chloride, Fluoride, Hydroxide, Nitrate, Nitrite, Total Kjeldahl Nitrogen, Ortho-phosphate, Phosphorus, TDS (calculated), Sulphate, Anion Sum, Cation Sum, Cation Balance | ✓ | ✓ | ✓ |
| Metals | Total Metals (full ICP-MS scan) | ✓ | ✓ | ✓ |
| Metals (extended: Methylmercury) | Methylmercury | – | ✓ | ✓ |
| Metals (extended: Hexavalent Chromium) | Hexavalent Chromium | – | – | ✓ |
| Aggregate Organics | Chemical Oxygen Demand (COD) | ✓ | – | – |
| Volatile Organic Compounds (VOCs) | Benzene, Toluene, Ethylbenzene, Xylenes (BTEX), m+p-xylenes, o-xylenes | – | ✓ | ✓ |
| Parameter Category | Analytes | 2019 | 2020 and 2021 | 2023 |
| Petroleum Hydrocarbon (PHCs) Fractions | PHC F1 -BTEX, PHC F1, PHF F2, PHC F3, PHC F4, Total Hydrocarbons (C6-C50) | – | ✓ | ✓ |
| Polycyclic Aromatic Hydrocarbons (PAHs) | Acenaphthene, Acenaphthylene, Acridine, Anthracene, Benzo(a)anthracene, Benzo(a)pyrene, Benzo(b,j)fluoranthene, Benzo(g,h,i)perylene, Benzo(k)fluoranthene, Chrysene, Dibenzo(a,h)anthracene, Fluoranthene, Fluorene, Indeno(1,2,3-cd)pyrene, Methylnaphthalene 1-, Methylnaphthalene 2-, Methylnaphthalene 1- & 2-, Naphthalene, Phenanthrene, Perylene, and Pyrene. | – | ✓ | ✓ |
| PAHs (extended) | Quinoline, benzo(a)pyrene Total Potency Equivalence (B(a)P TPE) | – | ✓ | – |
| Radioisotopes | Radium-226 | – | ✓ | ✓ |
| Radioisotopes (extended) | Thorium-232 | – | ✓ | – |
Notes:
✓ = Parameters included in sampling and testing
– = Parameters not measured in samples
7.2.1.4 Sediment Quality
The sediment quality sampling was conducted during the baseline aquatic field work program in October 2020. Sampling collection methods, QA/QC protocols, and application of relevant sediment quality guidelines are described in detail in the NEEC Report (Appendix F).
Sediment samples were acquired during the benthic invertebrate surveys from October 14 – 25, 2020. Due to poor weather and access conditions, samples were only collected at the five sampling locations listed in Table 7-8 and shown in Figure 7.2.
Table 7-8: Sediment Quality Sampling Sites
| Watershed | Waterbody Crossings Sampled |
| Winisk River | 2020: WC-3 (1) |
| Ekwan River | 2020: WC-15, WC-16 (2) |
| Attawapiskat River | 2020: WC-20, WC-24 (2) |
Standard sediment quality parameters were measured in all samples collected in 2020, which are summarized in
Table 7-9. Detailed analysis results are provided in the NEEC Report (Appendix F).
Table 7-9: Sediment Quality – Summary of Field Measuring and Laboratory Analytical Parameters Collected in 2020
| Parameter Category | Analytes |
| General Chemistry | Fraction of Organic Carbon, Moisture, Total Organic Carbon, Total Kjedahl Nitrogen |
| Metals | Aluminum, Antimony, Arsenic, Barium, Beryllium, Bismuth, Boron, Cadmium, Calcium, Chromium (total), Chromium (V), Cobalt, Copper, Iron, Lead, Magnesium, Manganese, Mercury, Molybdenum, Nickel, Phosphorous, Potassium, Selenium, Silver, Sodium, Strontium, Sulphur, Thallium, Titanium, Tin, Uranium, Vanadium, Zinc, Zirconium, Lithium |
7.2.2 Results
7.2.2.1 Surface Water Quantity
Baseline surface water quantity conditions were characterized at water crossings to support the design of water crossing structures. The objectives of the water crossings structures include minimizing erosion and flooding, protecting water quality, and maintaining aquatic diversity and are described in further detail in Section 4.3.2 (Drainage and Stormwater Management in the Project Description).
The estimated peak discharges for larger catchments were determined by considering the following methods:
- Index Flood Method (using OFAT);
- Modified Index Flood Method (MIFM);
- Transposition of Flood Discharge Method (using single station);
- Transposition of Flood Discharge Method (using Regional Flow Frequency Analysis [RFFA]);
- Northern Ontario Hydrology Method (NOHM); and
- Unified Ontario Flood Method (UOFM).
- Modified Index Flood Method (MIFM);
The peak discharges are summarized in Appendix 5-A of the NEEC Report (Appendix F).
For catchment areas greater than 100 km2, the OFAT, MIFM, Transposition of Single Station, and RFFA yielded the best results. MIFM was about 15% higher for catchments from 100 – 1000 km2, but over 40% for catchments greater than 1000 km2. Transposition of Single Station was generally about 15% higher than OFAT and RFFA was generally 10% lower than OFAT. For catchment areas less than 100 km2 (MIFM not applicable), the Transposition of Single Station was generally about 20% lower than OFAT results and RFFA were generally about 30% higher than OFAT results. The OFAT results (Index Flood Method) were selected as the most representative of the watercourse peaks, as they typically fell in the middle of all the results.
The NOHM (only from <100 km2) and the UOFM results were more than 90% less than all other methods. NOHM and UOFM rely on the total area of lakes and wetlands within the catchment. However, the wetland areas for the project are quite large (47% to 95%), resulting in an overly reduced discharge, as the peak is effectively damped by the wetland area, and these methods were not adopted.
The estimated peak discharges for smaller catchments were determined using Rational Method.
Table 3.1 in Appendix 5-A of the NEEC Report (Appendix 6) provides a summary of the waterbody crossing characteristics and the estimated peak discharge for the 1:50 year and 1:100 year storm events.
The flow, depth, and width data are summarized in Appendix 5-A of the NEEC Report (Appendix 6). It should be noted that, due to access constraints, several of the road waterbody crossings were not visited and therefore physical parameters/measurements were taken from either upstream or downstream of the actual proposed crossing location or from an aerial view.
The estimated high-water levels for the crossings are shown in Table 5-10 of the NEEC Report (Appendix 6). It should be noted that the hydraulic model geometries of the crossings are based on currently available field data collected for this project, LiDAR data, and orthophotos and further surveys of the crossings’ bathymetry will be taken during the next design stage to confirm the assumptions on flow, depth, and width data.
7.2.2.2 Surface Water Quality
There are three main watersheds within the project study areas, including Winisk, Upper Ekwan, and Attawapiskat watersheds. Surface water quality results for each of the three main watersheds are summarized in the following subsections. Detailed analytical results are presented in Appendix 5-B of the NEEC Report (Appendix 6). Statistical results are presented in Table 5-13 in the NEEC Report (Appendix 6). Exceedances of the Canadian Environmental Quality Guidelines (CEQG), Water Quality Guidelines for the Protection of Aquatic Life, Freshwater (CCME, 2023), the Provincial Water Quality Objectives (PWQO, Ministry of Environment [MOE] 1994), or Guidelines for Canadian Drinking Water Quality (GCDWQ, 2022) were not common, considering the large number of samples and parameters analyzed. However, some exceedances were observed. The greatest number of exceedances were observed in 2019, and exceedances of field pH, aluminum, and iron occurred in all four sampling years. Given the low degree of development in the LSA and RSA, the exceedances were likely naturally occurring from sources such as natural sediment deposition from weathering of rocks and potential atmospheric sources from distant emissions but could originate from a distant upstream source.
Analytical results for water quality in the Winisk River, Ekwan River, and Attawapiskat River watersheds are summarized in Table 7-10, Table 7-11, and Table 7-12, respectively.
Table 7-10: Summary of Analytical Results for Water Quality in the Winisk River Watershed
| Parameter | Units | Guideline | Values1 | Results | Comments |
| pH (field) | pH | CCME CEQG Aquatic Life Freshwater3: 9.0 (6.5-9.0) PWQO4:8.5 (6.5 – 8.5) GCDWQ5 MAC or AO: 10.5 (7.0 – 10.5) | 7.1 (6.3-7.9) | Neutral pH values;Mean values ranging from 6.60 to 7.71;Extreme values from 6.28 to 8.51; and Number of Exceedances2:12. | The mean values meet the MOE PWQOs, CCME CEQGs, and GCDWQ, but extreme values do not.Background pH levels were slightly acidic relative to aquatic life guidelines, but only in three locations the pH was within the guideline range during other sampling programs. |
| Turbidity | NTU | GCDWQ5 MAC or AO: 1 | 1.5 (0.3-2.6) | The samples have low particulate matter with high transparency and light penetration.Number of Exceedances2:11. | The is no guideline for Protection of Aquatic Life. The identified exceedances were related to a guideline criteria for treated drinking water which should only be used as a reference in the absence of other criteria. The measured turbidity was below 3 NTU is considered to be very low and can rise during runoff events. |
| Hardness | mg/L | na | 43.0 (23.8-62.2) | All sites 0-60 mg/L as CaCO3), except for location WB-1, ranged from 56 mg/L to 62 mg/L from 2019 to 2021. | All sites classified as soft water except for location WB-1 classifying the water as ranging from soft to moderately hard water (60 to <120 mg/L as CaCO3). |
| Temperature (field) | °C | na | 9.6 (0.85-18.4) | Field temperatures <19oC. | A cold-water habitat classification. |
| Total Alkalinity | mg/L | na | 43.3 (17.5-69.0) | 17.5 mg/L to 69 mg/L. | The water has some buffering capacity to neutralize acids; however, it falls on the lower end of the typical range for freshwater (20-200 mg/L) which means there could be a greater susceptibility to changes in pH. |
| Aluminum | µg/L | CCME CEQG Aquatic Life Freshwater3: 100 (pH>=6.5) 5 (pH<6.5)6 PWQO4: na GCDWQ5 MAC or AO: 100 | 50.6 (3.0-98.1) | Above CCME CEQG in Fall 2020 and Spring 2021.Number of Exceedances2:3. | All exceedances were the result of field pH being lower than 6.5. No samples exceeded the guideline for neutral pH levels (100 µg/L). |
| Parameter | Units | Guideline | Values1 | Results | Comments |
| Chromium | µg/L | CCME CEQG Aquatic Life Freshwater3: 1 PWQO4: 1 GCDWQ4 MAC or AO: 50 | 0.7 (0.1-1.2) | Above PWQO in Summer 2023.Number of Exceedances2:1. | The one exceedance was a unique outlier and within five times the detection limit. |
| Iron | µg/L | 300 | 375.5 (59.0-692.0) | Above PWQO, CCME CEQG, and GCDWQ in Summer 2019. Number of Exceedances2:5. | Iron concentrations were found to exceed the guideline at various locations and seasons, but are not considered high (>1000 µg/L). The concentrations were most likely driven by naturally occurring background levels. |
| Manganese | µg/L | CCME CEQG Aquatic Life Freshwater3: 430 GCDWQ5 MAC or AO: 20 | 32.4 (1.6-63.1) | Above GCDWQ in Summer 2023.Number of Exceedances2:8. | Manganese concentrations were within guideline criteria for aquatic life. The identified exceedances were related to a guideline criteria for treated drinking water which should only be used as a reference in the absence of other criteria. The sampled concentrations of manganese are not considered to be a concern. |
| VOCs and Hydrocarbons | mg/L | na | – | Near or below their respective reported detection limit (RDLs). | – |
| Select PAHs7 | µg/L | na | 0.05 | The RDLs were above the PWQO criteria in Fall 2020, Spring 2021, and Summer 2023. | – |
Notes:
1 Values shown depicte the statistical values of all samples collected in the watershed: mean (minimum – maximum).
2 The number of exceedances represent samples that exceed at least one guideline. The total number of samples collected was 26, including two duplicate samples.
3 Canadian Environmental Quality Guidelines (CEQG). Water Quality Guidelines for the Protection of Aquatic Life, Freshwater (CCME, 1999, as updated).
4 Provincial Water Quality Objectives (MOEE, 1994, reprinted 1999 version).
5 Guidelines for Canadian Drinking Water Quality (GCDWQ) Summary Table (Health Canada, September 2020).
6 Guideline varies with pH. Where pH is measured, the pH-specific guideline has been applied.
7 Select PAHs include anthracene, benzo(a)anthracene, benzo(g,h,i)perylene, benzo(k)fluoranthene, chrysene, dibenzo(a,h)anthracene, fluoranthene, and perylene.
Table 7-11: Summary of Analytical Results for Water Quality in the Ekwan River Watershed
| Parameter | Units | Guideline | Values1 | Results | Comments |
| pH (field) | pH | CCME CEQG Aquatic Life Freshwater3: 9.0 (6.5-9.0) PWQO4:8.5 (6.5 – 8.5) GCDWQ5 MAC or AO: 10.5 (7.0 – 10.5) | 6.9 (6.04-7.73) | Neutral, with more basic levels in Spring and Fall;Mean values ranged from 6.49 to 6.95;Extreme values ranged from 6.04 to 7.75;Values at WC-11, WC-13, and WC-16 in Spring 2021 did not meet the MOE PWQOs and CCME CEQGs; Most of values ranging from 6.04 to 6.95 measured in 2019, 2020, and 2021 did not meet GCDWQ; and Number of Exceedances2:14. | Background pH levels were slightly acidic relative to aquatic life guidelines, but only in three locations the pH was within the guideline range during other sampling programs. |
| Turbidity | NTU | GCDWQ5 MAC or AO: 1 | 2.8 (0.4-5.3) | The samples have low particulate matter with high transparency and light penetration.Number of Exceedances2:5. | The is no guideline for Protection of Aquatic Life. The identified exceedances were related to a guideline criteria for treated drinking water which should only be used as a reference in the absence of other criteria. The measured turbidity is considered to be low and can rise during runoff events. |
| Hardness | mg/L | na | 32.1 (16.1-48.0) | 16.1 mg/L to 48 mg/L. | Soft water (0 to <60 mg/L as CaCO3). |
| Temperature (field) | °C | na | 9.1 (0.5-17.6) | Field temperatures <19oC. | Classified as cold-water habitats. |
| Total Alkalinity | mg/L | na | 25.4 (9.8-41.0) | 9.8 mg/L to 41 mg/L. | The water has some buffering capacity to neutralize acids; however, it falls on the lower end of the typical range for freshwater (20-200 mg/L) which means there could be a greater susceptibility to changes in pH. |
| Parameter | Units | Guideline | Values1 | Results | Comments |
| Total phosphorus | mg/L | PWQO4: 0.03 | 0.04 (0.00-0.07) | Elevated total phosphorus concentrations were detected in Summer 2019 at the Upper Ekwan River’s main branch.Number of Exceedances2:1. | Eutrophic nutrient levels with high biological productivity. |
| Aluminum | µg/L | CCME CEQG Aquatic Life Freshwater3: 100 (pH>=6.5) 5 (pH<6.5)6 PWQO4: na GCDWQ5 MAC or AO: 100 | 196.0 (18.0-374.0) | Above the GCDWQ and CCME CEQG.Number of Exceedances2:4. | Most exceedances were the result of field pH being lower than 6.5. A single sample exceeded the guideline for neutral pH levels (100 µg/L), which was considered to be an outlier. |
| Chromium | µg/L | CCME CEQG Aquatic Life Freshwater3: 1 PWQO4: 1 GCDWQ5 MAC or AO: 50 | 0.7 (0.1-1.3) | Minor exceedances of chromium, cobalt, and zinc were detected above select guidelines and standards in Summer 2019.Number of Exceedances2:1. | One exceedance was recorded and was considered to be an outlier. |
| Iron | µg/L | 300 | 1,382.5 (115.0-2,650.0) | Above the PWQO, CCME CEQG, and GCDWQ at all sampling sites.In Fall 2020, an additional iron exceedance was observed at WC-11 and WC-13.Number of Exceedances2:8. | Iron concentrations were found to exceed the guideline at various locations and seasons, but are not considered high (>1000 µg/L). The concentrations were most likely driven by naturally occurring background levels. A single very high concentration (2,650 µg/L) was considered to be an outlier. |
| Manganese | µg/L | CCME CEQG Aquatic Life Freshwater3: 430 GCDWQ5 MAC or AO: 20 | 997.0 (4.0-1,990.0) | Above the GCDWQ at WC-9, WC-10, WC-13, WC15, and WC-16.Number of Exceedances2:8. | Manganese concentrations were within guideline criteria for aquatic life. The identified exceedances were related to a guideline criteria for treated drinking water which should only be used as a reference in the absence of other criteria. The sampled concentrations of manganese are not considered to be a concern. A single very high concentration (1,990 µg/L) was considered to be an outlier. |
| Parameter | Units | Guideline | Values1 | Results | Comments |
| Lead | µg/L | CCME CEQG Aquatic Life Freshwater3:1-1.976 8 PWQO4: 5 (Alkalinity <20) 1 (H<30) 10 (Alkalinity 20-40) 20 (Alkalinity 40-80) 3 (H 30-80) GCDWQ5 MAC or AO: 5 | 1.1 (0.05-2.07) | Above the PWQO and CCME CEQG in Summer 2019, but were below the detection limit and select guidelines in subsequent sampling period.Number of Exceedances2:1. | One exceedance was recorded and was considered to be an outlier. |
| Copper | µg/L | CCME CEQG Aquatic Life Freshwater3: 2 (H<82) 8 PWQO4: 5 (H>20) 8 GCDWQ5 MAC or AO: 1,000 | 1.7 (0.5-2.89) | Above the PWQO and CCME CEQG in Summer 2019, but were below the detection limit and select guidelines in subsequent sampling period.Number of Exceedances2:1. | One exceedance was recorded and was considered to be an outlier. |
| VOCs and Hydrocarbons | mg/L | na | – | Near or below their respective RDLs for all sampling sites. | – |
| Select PAHs7 | µg/L | na | – | The RDLs were above the PWQO criteria at all sampling sites in Fall 2020 and Spring 2021. | – |
Notes:
1 Values shown depicte the statistical values of all samples collected in the watershed: mean (minimum – maximum).
2 The number of exceedances represent samples that exceed at least one guideline. The total number of samples collected was 18, including two duplicate samples.
3 Canadian Environmental Quality Guidelines (CEQG). Water Quality Guidelines for the Protection of Aquatic Life, Freshwater (CCME, 1999, as updated).
4 Provincial Water Quality Objectives (MOEE, 1994, reprinted 1999 version).
5 Guidelines for Canadian Drinking Water Quality (GCDWQ) Summary Table (Health Canada, September 2020).
6 Guideline varies with pH. Where pH is measured, the pH-specific guideline has been applied.
7 Select PAHs include anthracene, benzo(a)anthracene, benzo(g,h,i)perylene, benzo(k)fluoranthene, chrysene, dibenzo(a,h)anthracene, fluoranthene, and perylene.
8 Guideline varies with hardness. Where hardness is measured, the hardness-specific guideline has been applied. If hardness is not analyzed, the most stringent guideline has been applied.
Table 7-12: Summary of Analytical Results for Water Quality in the Attawapiskat River Watershed
| Parameter | Units | Guideline | Values1 | Results | Comments |
| pH (field) | pH | CCME CEQG Aquatic Life Freshwater3: 9.0 (6.5-9.0) PWQO4:8.5 (6.5 – 8.5) GCDWQ5 MAC or AO: 10.5 (7.0 – 10.5) | 6.9 (6.2-7.6) | Neutral values, with more basic values in Spring and Fall.The mean pH values ranged from 6.50 to 6.87. The extreme values ranged from 6.15 to 7.75. The pH values ranging from 6.15 to 6.93 detected in Spring 2021 were generally basic, but only half the samples failed to meet the MOE PWQOs, CCME CEQGs, and GCDWQ. Number of Exceedances2:14. | Background pH levels were slightly acidic relative to aquatic life guidelines at four locations. Low pH levels were observed to be more persistent at sites in the Attawapiskat River Watershed when compared to the Winisk River and Ekwan River Watersheds. |
| Turbidity | NTU | GCDWQ5 MAC or AO: 1 | 8.1 (0.1-16.0) | Low particulate matter with high transparency and light penetration.Number of Exceedances2:7. | The is no guideline for Protection of Aquatic Life. The identified exceedances were related to a guideline criteria for treated drinking water which should only be used as a reference in the absence of other criteria. The measured turbidity is considered to be low and can rise during runoff events. |
| Hardness | mg/L | na | 44.2 (18.4-70.0) | 18.4 mg/L to 44.2 mg/L.Hardness at WC-26 in Summer 2019 was measured as 70 mg/L, classifying the water as ranging from soft to moderately hard water. In summer 2019. | Soft water (0-60 mg/L as CaCO3). |
| Temperature (field) | °C | na | 9.9 (0.4-19.3) | All six locations as cold-water aquatic habitats, except for WC-26 with a temperature exceeding 19oC. | – |
| Total Alkalinity | mg/L | na | 37.2 (12.3-62.0) | 12.4 mg/L to 62 mg/L. | The water has some buffering capacity to neutralize acids; however, it falls on the lower end of the typical range for freshwater, which is 20-200 mg/L. |
| Parameter | Units | Guideline | Values1 | Results | Comments |
| Total phosphorus | mg/L | PWQO4: 0.03 | 0.02 (0.004-0.03) | Just above the PWQO (0.03 mg/L).Number of Exceedances2:1. | – |
| Aluminum | µg/L | CCME CEQG Aquatic Life Freshwater3: 100 (pH>=6.5) 5 (pH<6.5)6 PWQO4: na GCDWQ5 MAC or AO: 100 | 181.5 (14.0-349.0) | Above the GCDWQ and CCME CEQG guidelines at WC-17, WC-24, and WC-26.Number of Exceedances2:10. | Most exceedances were the result of field pH being lower than 6.5. Three samples exceeded the guideline for neutral pH levels (100 µg/L). Of these three, two small exceedances at the same location, and the highest exceedance was considered to be an outlier. |
| Chromium | µg/L | CCME CEQG Aquatic Life Freshwater3: 1 PWQO4: 1 GCDWQ5 MAC or AO: 50 | 0.8 (0.1-1.4) | Above the PWQO and CCME CEQG guidelines at WC-26.Number of Exceedances2:1. | One exceedance was recorded and was considered to be an outlier. |
| Iron | µg/L | 300 | 1,481.0 (112.0- 2,580.0) | Above the PWQO and CCME CEQG at several sampling sites, including duplicate WC-26D.Half of these sites had exceedance in Fall 2020, with only WC-26 having an exceedance in Spring 2021.Number of Exceedances2:10. | Iron concentrations were found to exceed the guideline at various locations and seasons, but are not considered high (>1000 µg/L). The concentrations were most likely driven by naturally occurring background levels. A single very high concentration (2,580 µg/L) was considered to be an outlier. |
| Manganese | µg/L | CCME CEQG Aquatic Life Freshwater3: 430 GCDWQ5 MAC or AO: 20 | 80.3 (2.66-158.0) | Above the GCDWQ.Number of Exceedances2:6. | Manganese concentrations were within guideline criteria for aquatic life. The identified exceedances were related to a guideline criteria for treated drinking water which should only be used as a reference in the absence of other criteria. The sampled concentrations of manganese are not considered to be a concern. |
| VOCs and Hydrocarbons | mg/L | na | – | Near or below their respective RDLs for all sampling sites. | – |
| Parameter | Units | Guideline | Values1 | Results | Comments |
| Select PAHs7 | µg/L | na | – | The RDLs were above the PWQO criteria at all sampling sites in Fall 2020 and Spring 2021. | – |
Notes:
1 Values shown depicte the statistical values of all samples collected in the watershed: mean (minimum – maximum).
2 The number of exceedances represent samples that exceed at least one guideline. The total number of samples collected was 19, including one duplicate sample.
3 Canadian Environmental Quality Guidelines (CEQG). Water Quality Guidelines for the Protection of Aquatic Life, Freshwater (CCME, 1999, as updated).
4 Provincial Water Quality Objectives (MOEE, 1994, reprinted 1999 version).
5 Guidelines for Canadian Drinking Water Quality (GCDWQ) Summary Table (Health Canada, September 2020).
6 Guideline varies with pH. Where pH is measured, the pH-specific guideline has been applied.
7 Select PAHs include anthracene, benzo(a)anthracene, benzo(g,h,i)perylene, benzo(k)fluoranthene, chrysene, dibenzo(a,h)anthracene, fluoranthene, and perylene.
7.2.2.3 Sediment Quality
Sediment samples collected at waterbodies within Winisk, Upper Ekwan, and Attawapiskat watersheds in the LSA for the Project were generally fine-textured and appeared to contain considerable organic and decaying matter. Ekman grabs frequently grabbed small woody debris in most samples and multiple grabs were required to obtain sufficient sediment, especially as the fine-textured sediment tended to run out of the Ekman sampler. Small gravels were occasionally found in sediment samples collected within WC3-SD (Winiskisis Channel), but these gravels were subsequently removed from the substrate samples before analysis. The 2020 sample sites are summarized by watershed in Table 7-8.
Results from the parameters analyzed in the sediment samples were generally below the regulatory guidelines and standards, with the exception of the following parameters:
- Concentrations of Arsenic at WC-3 and WC-15, exceeded ISQG and MOE LEL. The concentration of arsenic of 12 µg/g in sample WC-20 equals the CCME PEHH criteria (12 µg/g).
- Concentration of total Chromium at WC-20 exceeds the MOE LEL only.
- RDL values for Chromium VI at WC-3 and WC-15 exceeds the CCME PEHH, whereas RDL values at WC-20 and WC-24 equals the CCME PEHH criteria (0.4 µg/g).
- Concentration of Iron at WC-3 and WC-20 exceeds the MOE LEL.
- Concentrations of Manganese at WC-3, WC-15, WC-20, and WC-24 MOE LEL.
- Exceedances of Fraction of Organic Carbon, Total Organic Carbon, and Total Kjeldahl Nitrogen were recorded above the MOE LEL standards at WC-3, WC-15, W-C16, WC-20, and WC-24.
The exceedances could occur from sources such as natural sediment deposition from weathering of rocks and potential atmospheric sources from distant emissions, given that there have been relatively limited resource development activities in the general project area.
7.3 Identification of Potential Effects, Pathways, and Indicators
As indicated in Table 7-5, some project activities may interact with and impose potential effects on the Surface Water Resources VC during the project construction and operations. This section describes the nature of the potential effects, the pathways that link the project activities and the effects, and the indicators that can be used to assess and measure the effects. Table 7-13 summarizes the potential effect pathways and effect indicators for the Surface Water Resources VC. The primary potential effects include alteration of surface water drainage pattern and flows and changes to surface water quality and sediment quality.
The descriptions of effect pathways are grouped by their potential effect to avoid repetition since many of the same effect pathways may occur during different phases of the project. The potential effects of accidental spills on surface water resources are assessed in Section 23 – Accidents and Malfunctions.
Indigenous community members raised concerns about how potential changes in surface water quality/patterns due to project activities may affect soils, vegetation and wildlife. A pathway of effects approach is applied to identify and address related VCs (and related indicators of change) additional to those identified in Appendix B of the ToR as they are identified and further ecological linkages become more evident. Pathways describe how project activities could result in a potential effect (e.g., dewatering may reduce in-stream discharge resulting in reduced streamflow or water levels in nearby waterbodies) during each project phase (i.e., construction and operations). For an example on a linkage to other VCs, hydrology
(e.g., changes to water availability) is a major evaluation criterion during the evaluation of wetland function which forms part of the vegetation effects analysis.
7.3.1 Change in Surface Water Quantity
There could be a change in surface water quantity as a result from changes to the surface water drainage patterns and flows during construction and throughout operations. The pathways in which such changes may occur are described below and the predicted net effects, including magnitude, likelihood, and duration, as a result of these changes are assessed in Section 7.5.
Dewatering, water takings → Decrease in-stream discharge → Reduced streamflow or water levels in nearby waterbodies
Dewatering of surface water at waterbodies and groundwater dewatering is likely required during construction to keep the work area dry for the construction of the structure foundations (e.g., bridges and culverts, etc.). Groundwater dewatering may also be required when extracting aggregate materials at quarry and borrowing sites if the extraction is advanced below the groundwater table. Water takings may also be required for other purposes including water use for camps, concrete production, dust control, and site restoration – seeding, etc. Dewatering and short-term water takings for construction and operations may result in temporarily reduced baseflow contributions from groundwater sources and streamflow or water levels in nearby waterbodies.
Indigenous community members raised concerns about the potential ecological consequences if peatlands were drained during the construction of the WSR. Recognizing the importance of peatlands to First Nations due to their ability to store carbon in their soils and hold a lot of freshwater, a “floating” road design – the proposed road will be constructed on top of the peat (no peat is removed) – will be used for the section of the WSR that crosses peatlands as described in Section 4.3.1.3.1 Road Design in Peatlands.
Water discharge → Changes to runoff rates and volumes, infiltration rates, and overland flow paths → Change to surface water drainage patterns and flows → Increased streamflow or water levels in nearby waterbodies
Short-term discharges of construction water, wastewater, or wash water from project activities may result in temporary increased streamflow or water levels in nearby waterbodies.
Vegetation clearing and grubbing → Alteration of vegetation coverage → Changes to runoff rates and volumes, infiltration rates, and overland flow paths → Change to surface water drainage patterns and flows
Alterations to land cover may result in changes to runoff rates and volumes, infiltration rates, and overland flow paths. These changes would include permanent alterations (operations phase) such as roadway construction as well as temporary alterations (construction phase) such as vegetation clearing outside of permanent structure footprints, stockpiles, and laydown preparation. Changes to runoff rates and runoff volumes due to changes in land cover in the Project Footprint would result in decreased infiltration and increased streamflow or water levels during construction and operations.
Construction of permanent or temporary structures (culverts and bridges) at waterbody crossings → Change in-stream discharge, channel flow depth/water level and velocity → Change to surface water drainage patterns and flows
Construction of culverts and bridges will temporarily alter discharge rates and flow paths at waterbody crossings. Changes to local hydraulics (flow depth/water level and velocity) at and around constructed waterbody crossings could result in an increase or reduction of local shear stress, erosion, water levels, and sedimentation upstream or downstream of the crossings during the operations phase. For example, the short-term flow diversion will involve the
use of a temporary dam and pump bypass system (active in-stream diversion) or temporary diversion channels and/or dams (passive in-stream diversion). The implementation of short-term water diversions, in combination with the construction and removal of temporary waterbody crossing structures, may result in changes to surface water quantity.
Operations, maintenance, and repair of road → Changes to runoff rates and volumes, infiltration rates, and overland flow paths → Change to surface water drainage patterns and flows
Changes in overland flow paths due to road drainage system maintenance, winter snow clearing, localize road surface repairs, and vegetation control may result in an increased or decreased streamflow or water levels in the local receiving bodies.
The effects of project activities outlined in the effect pathways above on surface water drainage patterns and flows can be indicated through observable erosion in areas that were previously stable, water levels exceeding channel banks on a continual basis, and changes to annual water levels within waterbodies upstream or downstream.
Surface water and groundwater conditions are strongly associated and as runoff rates increase, rates of infiltration and recharge to groundwater decrease. The vitality of fish and their habitats, vegetation, and wetlands is contingent upon the combined impacts to surface water discharge and its dynamic connection to groundwater.
7.3.2 Change in Surface Water Quality
The surface water quality can be affected by alterations to drainage pattern and flows in addition to potential spills or releases of chemicals and pollutants. The pathways or activities which may result in changes to surface water quality include the following:
Dewatering and discharging → Disturbance of subsurface soils → Elevated sediment levels in discharge water
→ Reduction in surface water quality
When the extracted water from dewatering activities is discharged to the natural environment and reaches nearby surface water bodies, it may impair the surface water quality by introducing the extra sediment (e.g., total suspended solids) to the surface water.
Short-term discharges of construction water, wastewater, or wash water could result in temporary increases to chemical constituents and exceedances of water quality guidelines in nearby waterbodies.
Indigenous community members raised concerns about how dewatering activities during the project construction may affect levels of methylmercury and other environmental effects. Methylmercury and other water quality concerns (parameters) have been included in the surface water baseline investigation program. Surface water quality was monitored for seasonal and annual changes during the EA/IA process. A Surface Water and Storm Water Management and Monitoring Plan will be developed during detail design as part of the Construction Environmental Management Plan (CEMP) and the Operation Environmental Management Plan (OEMP) for implementation in the construction and operation phases.
Accidental spills or leaks → Leaching and infiltration, overland flow with surface runoff → Reduction in surface water quality
Accidental spills or leaks originating from construction machinery and road traffic have the potential to reach surface water through runoff during precipitation events, either flowing along surfaces or entering road stormwater drainage systems. These spills, carrying heavy pollutants, can lead to the contamination of surface water, influencing its quality and depositing the sediment in the bed of waterbodies. Potential effects of accidental spills are assessed in Section 23 – Accidents and Malfunctions.
Construction and maintenance activities → Generation of airborne particulate matter → Reduction in surface water quality
Construction and maintenance activities can produce airborne particulate matter (e.g., dust) that has the potential to settle directly onto the water surface or be transported by the wind into nearby waterbodies. This introduction of contaminants may adversely influence water quality by raising concentrations of deleterious substances.
Fugitive dust concerns expressed by an Indigenous community will be addressed by the use of the industry best management practices. Water trucks and the use of erosion and sediment control measures will be used along the road right-of-way to eliminate or reduce potential effects of fugitive dust on the water quality.
The potential impact of runoff from bridges will be addressed through stormwater management designs. Conduits to direct stormwater runoff for treatment, such as stormwater management ponds, will be incorporated into the road design if deemed necessary to minimize the potential impacts to surface water quality.
Blasting of rocks → Introduction of deleterious substances → Reduction in surface water quality
Blasting activities can release contaminants into the air that may settle into nearby waterbodies or reach surface water through runoff. Chemical constituents from blasting can change surface water quality by introducing compounds not naturally present in surface water.
Road maintenance activities → Deposition and transportation of sediment into waterbodies → Reduction in surface water quality
Road drainage system maintenance, winter snow clearing, localize road surface repairs, and vegetation control could result in deposition of sediment into nearby waterways and changes to water chemistry.
The effects of project construction and operation activities on surface water can be monitored through the comparison of suspended sediment and chemical constituent concentrations with baseline characterization of surface water quality derived from samples from waterbody crossings and naturally occurring rates of erosion and sedimentation.
Changes to infiltrating water quality may have a lasting effect on groundwater quality due to the dynamic interaction. The vitality of fish, fish habitat, vegetation, and wetlands relies on specific criteria related to water quality, making them directly vulnerable to changes in surface water quality.
7.3.3 Change in Sediment Quality
The sediment quality in waterbodies can be affected by erosion of stockpiles and the road from changes to drainage pattern and flows in addition to potential spills or releases of chemicals and pollutants. The pathways or activities which may result in changes to sediment quality include the following:
Dewatering and discharging → Disturbance of subsurface soils → Elevated sediment levels in discharge water
→ Reduction in sediment quality
Short -term discharges, carrying diverse chemical constituents, may directly enter surface waterbodies via drainage systems or nearby water channels. This flow has the potential to modify the chemical composition, thereby affecting sediment quality as dissolved substances settle within the sediment.
Construction and maintenance activities → Generation of airborne particulate matter → Reduction in sediment quality
Airborne particulate matter from construction and maintenance activities has the potential to settle directly onto the water surface or be transported by the wind into nearby waterbodies. This introduction of contaminants influences water quality and may have a lasting effect on sediment as the particles gradually settle over time.
Blasting of rocks → Introduction of deleterious substances → Reduction in sediment quality
Contaminants released into the air during blasting activities may settle onto nearby waterbodies or reach surface water through runoff. Chemical constituents from blasting can change surface water quality, and potentially settle in the sediment, and thereby, influencing its overall sediment quality.
Construction and maintenance activities → Deposition and transportation of sediment into waterbodies →Reduction in sediment quality
Runoff, erosion, and sedimentation processes associated with construction activities may lead to the transportation of suspended solids and particulate matter into waterbodies. The introduction of suspended solids can affect water quality, with the potential for these particles to settle in sediment and modify its composition.
Road drainage system maintenance, winter snow clearing, localize road surface repairs, and vegetation control could result in deposition of sediment into nearby waterways.
Accidental spills or leaks → Leaching and infiltration, overland flow with surface runoff → Reduction in sediment quality
Accidental spills, arising from construction machinery and road traffic, may reach surface water through diverse mechanisms, potentially affecting both water and sediment. These spills, laden with substance pollutants, have the potential to contaminate surface water through runoff during precipitation events, either by flowing along surfaces or entering the road stormwater drainage system that ultimately outlets to a waterbody. Consequently, they contribute to the degradation of water quality and settle within the sediment in the bed of waterbodies. The potential effects of spills on water quality and sediment quality are assessed in Section 23 – Accidents and Malfunctions.
The assessment of potential effects of project construction and operations on surface water and sediment quality involves evaluating changes in concentrations of suspended sediment and chemical constituents in water quality at waterbody crossings. This assessment takes specific activities into consideration as indicators of change such as increased sediment dislodgment from vehicle activities, sedimentation downstream of stockpile areas, and sediment discharge during the loading and unloading of construction materials.
Table 7-13: Potential Effects, Pathways, and Indicators for Surface Water Resources VC
| Potential Effect | Project Phase | Effect Pathway | Effect Indicators | Nature of Interaction and Effect (Direct or Indirect) | Linked VCs |
| Surface Water Quantity | |||||
| Change in surface water quantity | Construction | Short-term water takings for construction activities such as for needs in dust suppression, water use for camps, and dewatering.Short-term discharges of construction water, wastewater, or wash water.Alterations to landcover resulting in changes to runoff rates, runoff volumes, infiltration rates, and overland flow paths.Installation of bridges and culverts may temporarily impact discharge rates upstream or downstream of waterbody crossings during construction.Temporary changes to local hydraulics (flow depth/water level and velocity) at and around waterbody crossings. | Stream discharge (variety of flow conditions including mean annual, monthly, and event based-discharges);Channel hydraulics (flow depth/water level and velocity);Erosion and sedimentation; andOverland runoff drainage patterns. | Direct | Groundwater Resources (Section 8);Fish and Fish Habitat (Section 10);Vegetation and Wetlands (Section 11);Species at Risk (Section 13);Non-Traditional Land and Resource Use (Section 16); andAboriginal and Treaty Rights and Interests (Section 19). |
| Change in surface water quantity | Operations | Short-term water takings for operations such as dust suppression.Permanent changes to local hydraulics (flow depth/water level and velocity) at waterbody crossings including confinement of discharge through bridges and culverts.Alterations to landcover resulting in changes to runoff rates, runoff volumes, infiltration rates, and overland flow paths.Road maintenance resulting in changes to overland runoff drainage patters. | Stream discharge (variety of flow conditions including mean annual, monthly, and event based-discharges);Channel hydraulics (flow depth/water level and velocity);Erosion and sedimentation; andOverland runoff drainage patterns. | Direct | Groundwater Resources (Section 8);Fish and Fish Habitat (Section 10);Vegetation and Wetlands (Section 11);Species at Risk (Section 13);Non-Traditional Land and Resource Use (Section 16); andAboriginal and Treaty Rights and Interests (Section 19). |
| Change in surface water quality | Construction | Short-term discharges of construction water, wastewater, or wash water.Airborne particulate matter from construction activities.Blasting activities releasing chemical constituents into nearby waterbodies.Construction activities that cause erosion and sedimentation typically result in increased suspended solids and particulate matter entering waterbodies. | Concentration of suspended solids;Concentration of chemical constituents; andErosion and sedimentation. | Direct | Groundwater Resources (Section 8);Fish and Fish Habitat (Section 10);Vegetation and Wetlands (Section 11);Species at Risk (Section 13);Non-Traditional Land and Resource Use (Section 16); andAboriginal and Treaty Rights and Interests (Section 19). |
| Change in surface water quality | Operations | Runoff and erosion from constructed surfaces of roads and developed areas lead to the transportation of suspended solids and particulate matter into waterbodies.Road maintenance activities leading to the deposition of sediment into waterbodies. | Concentration of suspended solids;Concentration of chemical constituents; andErosion and sedimentation. | Direct | Groundwater Resources (Section 8);Fish and Fish Habitat (Section 10);Vegetation and Wetlands (Section 11);Species at Risk (Section 13);Non-Traditional Land and Resource Use (Section 16); andAboriginal and Treaty Rights and Interests (Section 19). |
| Potential Effect | Project Phase | Effect Pathway | Effect Indicators | Nature of Interaction and Effect (Direct or Indirect) | Linked VCs |
| Sediment Quality | |||||
| Change in sediment quality | Construction | Short-term discharges of construction water, wastewater, or wash water.Airborne particulate matter from construction activities.Blasting activities releasing chemical constituents into nearby waterbodies.Alteration of land surfaces (i.e., land clearing and grading) leading to increased sediment transport.Construction activities that cause erosion and sedimentation typically result in increased suspended solids and particulate matter entering waterbodies. | Concentration of suspended solids;Concentration of chemical constituents; andErosion and sedimentation. | Direct | Fish and Fish Habitat (Section 10);Vegetation and Wetlands (Section 11);Species at Risk (Section 13);Non-Traditional Land and Resource Use (Section 16); andAboriginal and Treaty Rights and Interests (Section 19). |
| Change in sediment quality | Operations | Runoff and erosion from constructed surfaces of roads and developed areas lead to the transportation of suspended solids and particulate matter into waterbodies.Road maintenance activities leading to the deposition of sediment. | Concentration of suspended solids;Concentration of chemical constituents; andErosion and sedimentation. | Direct | Fish and Fish Habitat (Section 10);Vegetation and Wetlands (Section 11);Species at Risk (Section 13);Non-Traditional Land and Resource Use (Section 16); andAboriginal and Treaty Rights and Interests (Section 19). |
7.4 Mitigation Measures
This section describes the proposed mitigation measures to eliminate, reduce, control, or offset potential adverse effects to water quantity, water quality and sediment quality during construction and operations of the Project as detailed in Section 7.3. Mitigation measures are described for each key project activity that may result in potential adverse effects to water quantity, water quality and/or sediment quality. Further measures will be provided in the CEMP and the Operation Environmental Management Plan (OEMP) that will be developed for the Project. Refer to Section 4.6 for details of the proposed framework for the development of the CEMP and the OEMP.
| Indigenous community members will have an active role in developing and implementing management plans. |
| An Environment Committee will be established to facilitate communication and engagement during construction and operations of the Project. Committee members will include Webequie First Nation Elders and Knowledge Holders, other Indigenous Nations, and appropriate project representatives, to: facilitate communication and engagement during construction and operations of the Project; facilitate use of Indigenous Knowledge in project activities; facilitate evaluation of land use information; and facilitate development of appropriate monitoring programs, protocols and management plans as it relates to Surface Water Resources VC. |
In addition to the mitigation measures described below, the preliminary recommended preferred route was selected to minimize watercourse crossing spans and hydrology issues at watercourse crossings. The full route optimization criteria are presented in Appendix D-1 – Preliminary Engineering Design Report.
7.4.1 Dewatering, Water Takings, and Discharges
Indigenous community members raised concerns about the potential ecological consequences if peatlands were drained during the construction of the WSR. Recognizing the importance of peatlands to First Nations due to their ability to store carbon in their soils and hold a lot of freshwater, a “floating” road design – the proposed road will be constructed on top of the peat (no peat is removed) – will be used for the section of the WSR that crosses peatlands as described in Section 4.3.1.3.1 Road Design in Peatlands.
Regulated by MECP Permits
All short-term water takings from surface water and/or groundwater sources for construction purposes will be carried out in accordance with O. Reg. 387/04, as amended by O. Reg. 64/16 under the Ontario Water Resources Act, and industry best standards. Based on the dewatering assessment results described in Section 8.3.5, the maximum
(worst-case) daily water taking volumes are estimated to be more than 400,000 L/day. Therefore, a permit to take water (PTTW) will be required for the Project. At some locations, the dewatering volumes may be more than 50,000 L/day, but less than 400,000 L/day. In this situation, an Environmental Activity and Sector Registry (EASR) registration (for Water Taking) will be used to permit the activity. Several dewatering sources/locations can be combined and included in the same EASR registration or PTTW application.
As part of the supporting documents for the PTTW or EASR applications, hydrogeological studies are required to detail the dewatering and impact assessments, discharge plans, mitigation measures and monitoring plans. Discharge water quality should be tested and meet Ontario PWQO as water will likely be discharged to the natural environment. Detailed discharge monitoring plans including discharge water quality testing, and contingency measures recommended in the hydrogeological studies as supporting documents for the PTTW application or EASR registration should be followed. In
general, the applicants and contractors are required to comply with terms and conditions of the approved PTTW or EASR, including monitoring and reporting to verify compliance.
Other Related Mitigation Measures
Dewatering activities should, at a minimum, follow Ontario Provincial Standard Specification (OPSS) 517 Dewatering of Pipeline, Utility, and Associated Structure Excavation and OPSS 518 Construction Specification for Control of Water from Dewatering Operations.
Erosion and Sediment Control measures (e.g., OPSS 805, Construction Specification for Temporary Erosion and Sediment Control Measures) should be incorporated into the detail design and implemented during construction to prevent erosion and migration of soils from the work site during rainfall events. Geotextile filter bag(s) or equivalent sediment trap should also be used at a minimum during dewatering activities to capture and treat dewatering effluent that may have elevated level of sediment (suspended solids). Discharge locations should be at least 30 m away from waterbodies.
Use industry best management practices (BMP) to minimize dewatering/pumping volumes:
- Temporary supporting systems can be used, where feasible, to help reduce the amount of groundwater inflow into the excavations.
- Surface water runoff will be directed away from the open excavations to reduce rain and surface water contribution to the total dewatering volumes.
For more detailed descriptions of proposed mitigation measures, refer to Section 5.20 (Quarry Site Selection and Development Requirements) in Appendix E – Mitigation Measures.
7.4.2 Vegetation Clearing and Grubbing
Alterations to land cover may result in changes to runoff rates and volumes, infiltration rates, and overland flow paths. To minimize the effects on runoff rates and increases to surface water quantities due to vegetation clearing and grubbing, the disturbed areas (for temporary supporting infrastructure) can be restored through decompaction of soil and placement of similar native soils (removed or excavated from the same area) or materials that are more permeable than the native soils, where practical. This along with planting of vegetation as part of the site rehabilitation will restore or increase infiltration rates and prevent or reduce soil erosion.
For more detailed descriptions of proposed mitigation measures, refer to Section 5.1 (Clearing and Grubbing) and Section 5.21 (Site Decommissioning and Rehabilitation) in Appendix E – Mitigation Measures.
7.4.3 Installation of Culverts and Bridges
Construction of permanent and temporary waterbody crossing structures will be timed for low-flow conditions to minimize the effect of temporary diversions on stream discharge. Erosion and sediment control measures, including temporary flow diversions or bypass pumping to isolate the work zone will be implemented throughout the construction phase by the Contractor to prevent or reduce environmental effects. These erosion and sediment control management practices include, but are not limited to sediment fences, sedimentation ponds, check dams, and erosion control fabric. Water quality will be directly mitigated through the implementation of spill response and storage and handling procedures for materials that have the potential for adverse interaction with surface water quality and indirectly mitigated through erosion control and water quantity mitigation measures. Water quality monitoring will be implemented during construction to identify exceedances of water quality guidelines and information. Construction operators’ work may need to be temporarily halted or additional mitigation methods be applied.
As discussed in Section 10 – Fish and Fish Habitat, the majority of activities with the potential to affect fish and fish habitat will be conducted within the appropriate timing windows for in water or near water work, as determined by the, MNR and DFO in consultation with Webequie First Nation and other First Nations. This will include clustering the construction of waterbody crossings outside of these windows to reduce overall time in waterbodies and potential effects to surface water. Based on the fish species present in the project study area, the restricted activity timing window is April 1 to June 20, except for the restricted activity timing window for Winisk Lake (September 1 to June 15). If in water work is required during the restricted activity timing window, DFO and MNR will be consulted well in advance to request and seek permission for an extension to the fisheries timing window.
For more detailed descriptions of proposed mitigation measures, refer to Section 5.11 (Bridge and Culvert Installation) in Appendix E – Mitigation Measures.
7.4.4 Permanent Waterbody Crossings
To mitigate potential changes to water quantity (flow/discharge, water levels), waterbody crossings will be designed with single-span elements (bridges or culverts), where possible, to limit the encroachment of structures into stream channels and thereby minimize the effect on discharge under variable flow conditions. As a result, three waterbody crossings require multiple spans (WB-1, WC-3, and WC-27), and 28 crossings were designed with single-span elements.
Hydrology estimates used to size waterbody crossing structures were based on 100-year return period peak flood events and included an increase adjustment, or up-sizing, to account for climate change. The adjustment for climate change incorporates potential increases to peak precipitation events and rises in annual temperatures and varies depending on the peak discharge method. The structures from a hydraulic perspective have been designed to pass frequent floods or precipitation events (2-year return period) with minimal effect on stream discharge, accommodate fish passage requirements (MTO, Department of Fisheries and Oceans Canada [DFO]) and where navigable waterways were identified the design of culverts and bridges has made allowance for a minimum navigational clearance, or opening, for small motorized and unmotorized watercraft passage.
7.4.5 Roadway Drainage Design
To mitigate potential changes to water quality, the roadway and swales were designed with consideration of low impact development procedures for linear infrastructure. These features include permanent enhanced swales that are designed to convey, treat, and attenuate stormwater runoff from the road. Enhanced grass swales incorporate design features such as modified geometry and rock check dams that improve the contaminant removal and runoff reduction functions of simple grass channel roadside ditch designs. The topography along the length of the road, particularly the east half of the WSR, is very flat with shallow relief. Drainage cross-culverts (900 mm diameter) are designed to be installed at regular intervals in lowland areas to prevent water from ponding on either side of the roadway and allow overland flow to follow existing hydrological flow paths. Additionally, the road cross-fall is designed to continue draining water after deterioration of the loose gravel road surface until seasonal maintenance operations crews return to reshape the roadway.
7.4.6 Accidental Spills and Leaks
Fuel spills, leaks and releases present a hazard to human health and safety, and can be a threat to soil, groundwater and aquifers, surface water, vegetation, wetlands, and wildlife habitats. Besides the potential impacts on health and the environment, there may be significant costs associated with wasted fuel, treatment of oily wastewater, and remediation of fuel-impacted sites.
General mitigation measures to prevent accidental spills and leaks include proper handling and storage of petroleum and other hazardous materials. Emergency response plans will be in place for any spills of hazardous material including thorough documentation of the incident and clean-up response.
For more detailed descriptions of proposed mitigation measures, refer to Section 5.2 (Petroleum Handling and Storage), Section 5.3 (Spill Prevention and Emergency Response), and Section 5.5 (Materials Handling and Storage) in
Appendix E – Mitigation Measures.
7.4.7 Blasting of Rock
The blasting with explosives will be limited to the places where other options are not feasible. Wherever practical, alternatives including bedrock ripping, typical or standard drilling, hammering, and non-explosive agent (e.g., expanding grout) can be considered. A Construction Blasting Management Plan for the Project will be prepared and submitted by applicable contractor(s) after contract award prior to initiation of blasting activities (refer to Section 2.1.3 in Appendix E – Mitigation Measures.
If blasting is required, it should be conducted in accordance with Ontario Provincial Standard Specification (OPSS) 120 General Specification for the Use of Explosive. A pre-blasting survey will be conducted to identify water supply wells and other environmentally sensitive features within 250 m from the blasting location. Mitigation measures will be modified or enhanced, if needed, based on the survey results. Blasting will not be conducted within 50 m of water supply wells (if any) and should be avoided in shallow groundwater table areas, where possible.
For more detailed descriptions of proposed mitigation measures, refer to Section 5.12 (Blasting near a watercourse) and Section 5.20 (Quarry Site Selection and Development Requirements) in Appendix E – Mitigation Measures.
7.4.8 Construction and Maintenance Activities
Construction and maintenance activities can produce airborne particulate matter (e.g., dust) that has the potential to settle directly onto the water surface or be transported by the wind into nearby waterbodies. Water will be used to control the dispersion of dust. When deemed necessary, exposed excavations, disturbed ground surfaces and traffic areas will be sprayed with water. If chemical dust suppressants are proposed, they will not be applied within 100 m of a water crossing.
For more detailed descriptions of proposed mitigation measures, refer to Section 5.18 (Dust Control Practices) in Appendix E – Mitigation Measures.
7.4.9 Disposal of Waste
A construction waste management plan will be developed to minimize the amount of the waste to be generated, and the portion going to landfills, by applying industry BMP including collection, recycling and disposal. All the solid and sewage wastes collected will be disposed and treated at designated facilities.
Domestic wastewater and sewage in the form of liquid effluent generated from portable sewage treatment facilities at construction camps and the Maintenance and Storage Facility may be treated on site using portable facilities (e.g., septic tank) or transported offsite by tanker truck for treatment at approved disposal facilities, depending on available facilities.
For more detailed descriptions of proposed mitigation measures, refer to Section 5.5 (Materials Handling and Storage) and Section 5.22 (Water Quality Monitoring) in Appendix E – Mitigation Measures.
7.4.10 Summary
Table 7-14 identifies key mitigation measures outlined in Appendix E of the EAR/IS to eliminate or reduce potential adverse effects of the Project. These mitigation measures reflect environmental protection guidelines to protect “Environmentally Sensitive Areas” as described in the Webequie First Nation On-Reserve Land Use Plan (Webequie First Nation, 2019a). Further measures will be provided in the CEMP and the OEMP that will be developed for the Project. Refer to Section 4.6 for details of the proposed framework for the development of the CEMP and the OEMP.
The following sections in Appendix E (Mitigation Measures) describe mitigation measures to prevent or limit the effect of construction and operations on water quantity:
- Section 5.1 – Clearing and Grubbing;
- Section 5.5 – Materials Handling and Storage;
- Section 5.6 – Working Within or Near Fish Bearing Watercourses;
- Section 5.7 – Temporary Watercourse Crossings;
- Section 5.8 – Temporary Watercourse Diversions;
- Section 5.9 – Fish Passage;
- Section 5.10 – Fish Salvage;
- Section 5.11 – Bridge and Culvert Installation;
- Section 5.18 – Dust Control Practices;
- Section 5.19 – Aggregate Pit Decommissioning;
- Section 5.20 – Quarry Site Selection and Development Requirements; and
- Section 5.21 – Site Decommissioning and Rehabilitation.
The following sections in Appendix E (Mitigation Measures) describe mitigations measures to prevent or limit the effect of construction and operations on water quality:
- Section 5.1 – Clearing and Grubbing;
- Section 5.2 – Petroleum Handling and Storage;
- Section 5.3 – Spill Prevention and Emergency Response;
- Section 5.5 – Materials Handling and Storage;
- Section 5.6 – Working Within or Near Fish Bearing Watercourses;
- Section 5.7 – Temporary Watercourse Crossings;
- Section 5.8 – Temporary Watercourse Diversions;
- Section 5.11 – Bridge and Culvert Installation;
- Section 5.12 – Blasting Near a Watercourse;
- Section 5.16 – Erosion and Sediment Control;
- Section 5.17 – Concrete Washout Management Practices;
- Section 5.18 – Dust Control Practices; and
- Section 5.22 – Water Quality Monitoring.
The following sections in Appendix E (Mitigation Measures) describe mitigations measures to prevent or limit the effect of construction and operations on sediment quality:
- Section 5.1 – Clearing and Grubbing;
- Section 5.2 – Petroleum Handling and Storage;
- Section 5.3 – Spill Prevention and Emergency Response;
- Section 5.5 – Materials Handling and Storage;
- Section 5.6 – Working Within or Near Fish Bearing Watercourses;
- Section 5.7 – Watercourse Crossings;
- Section 5.8 – Temporary Watercourse Diversions;
- Section 5.11 – Culvert Maintenance and Installation;
- Section 5.12 – Blasting Near a Watercourse;
- Section 5.16 – Erosion and Sediment Control;
- Section 5.17 – Concrete Washout Management Practices;
- Section 5.18 – Dust Control Practices;
- Section 5.20 – Quarry Site Selection and Development Requirements;
- Section 5.21 – Site Decommissioning and Rehabilitation; and
- Section 5.22 – Water Quality Monitoring.
Table 7-14: Summary of Potential Effects, Mitigation Measures, and Predicted Net Effects for Surface Water Resources VC
| VC Subcomponent | Indicators | Project Phase | Project Component or Activity | Potential Effect | Key Mitigation Measures | Predicted Net Effect |
| Surface Water Quantity | Stream discharge (variety of flow conditions including mean annual, monthly, and event based-discharges) | Construction | Construction and use of support infrastructure;Construction of road; andConstruction of permanent waterbody crossings. | Change in surface water quantity | Waterbody crossings will be designed with single-span elements (bridges or culverts), where possible, to limit the encroachment of structures into stream channels and thereby minimize the effect on discharge under variable flow conditions.Refer to Appendix E – Mitigation Measures:Section 5.5 – Materials Handling and Storage;Section 5.6 – Working Within or Near Fish Bearing Watercourses;Section 5.7 – Temporary Watercourse Crossings;Section 5.8 – Temporary Watercourse Diversions;Section 5.9 – Fish Passage;Section 5.10 – Fish Salvage;Section 5.11 – Bridge and Culvert Installation;Section 5.18 – Dust Control Practices; andSection 5.19 – Aggregate Pit Decommissioning. | Yes |
| Surface Water Quantity | Channel hydraulics (flow depth/water level and velocity) | Construction | Construction and use of support infrastructure;Construction of road; andConstruction of permanent waterbody crossings. | Change in surface water quantity | Waterbody crossings will be designed with single-span elements (bridges or culverts), where possible, to limit the encroachment of structures into stream channels and thereby minimize the effect on discharge under variable flow conditions.Refer to Appendix E – Mitigation Measures:Section 5.6 – Working Within or Near Fish Bearing Watercourses;Section 5.7 – Temporary Watercourse Crossings;Section 5.8 – Temporary Watercourse Diversions;Section 5.9 – Fish Passage;Section 5.10 – Fish Salvage;Section 5.11 – Bridge and Culvert Installation; andSection 5.16 – Erosion and Sediment Control. | Yes |
| Surface Water Quantity | Erosion and sedimentation | Construction | Vegetation clearing and grubbing;Construction and use of support infrastructure;Construction of road;Construction of permanent waterbody crossings; andClean-up and site restoration. | Change in surface water quantity | The disturbed areas from vegetation and clearing will be restored with native soils (removed or excavated in the same area) or materials that are more permeable than the native soils, where practical, and covered by native vegetation. This can help restore or increase infiltration rates and groundwater levels and prevent or reduce soil erosion.Erosion and Sediment Control measures (e.g., OPSS 805, Construction Specification for Temporary Erosion and Sediment Control Measures) will be incorporated into the detail design and implemented during construction to prevent erosion and migration of soils from the work site during rainfall events.Refer to Appendix E – Mitigation Measures:Section 5.1 – Clearing and Grubbing;Section 5.6 – Working Within or Near Fish Bearing Watercourses;Section 5.7 – Temporary Watercourse Crossings;Section 5.8 – Temporary Watercourse Diversions; | No |
| VC Subcomponent | Indicators | Project Phase | Project Component or Activity | Potential Effect | Key Mitigation Measures | Predicted Net Effect |
| Section 5.11 – Bridge and Culvert Installation;Section 5.16 – Erosion and Sediment Control;Section 5.18 – Dust Control Practices;Section 5.19 – Aggregate Pit Decommissioning; andSection 5.21 – Site Decommissioning and Rehabilitation. | ||||||
| Surface Water Quantity | Overland runoff drainage patterns | Construction | Construction and use of support infrastructure;Construction of road; andConstruction of permanent waterbody crossings. | Change in surface water quantity | Waterbody crossings will be designed with single-span elements (bridges or culverts), where possible, to limit the encroachment of structures into stream channels and thereby minimize the effect on discharge under variable flow conditions.The roadway and swales will be designed with consideration of low impact development procedures for linear infrastructure. These features include permanent enhanced swales that are designed to convey, treat, and attenuate stormwater runoff from the road.The road cross-fall will be designed to drain water after deterioration of the loose gravel road surface until seasonal maintenance operations crews return to reshape the roadway.Cross-culverts will be installed at regular intervals along the road (non-waterbody areas) within the lowlands/peatlands to convey surface drainage and movement subsurface groundwater flow through the road.Refer to Appendix E – Mitigation Measures:Section 5.1 – Clearing and Grubbing;Section 5.6 – Working Within or Near Fish Bearing Watercourses;Section 5.7 – Temporary Watercourse Crossings;Section 5.8 – Temporary Watercourse Diversions;Section 5.9 – Fish Passage;Section 5.10 – Fish Salvage;Section 5.11 – Bridge and Culvert Installation;Section 5.16 – Erosion and Sediment Control;Section 5.19 – Aggregate Pit Decommissioning; andSection 5.21 – Site Decommissioning and Rehabilitation. | Yes |
| Surface Water Quantity | Stream discharge (variety of flow conditions including mean annual, monthly, and event based-discharges) | Operations | Road drainage system maintenance. | Change in surface water quantity | Waterbody crossings will be designed with single-span elements (bridges or culverts), where possible, to limit the encroachment of structures into stream channels and thereby minimize the effect on discharge under variable flow conditions.Refer to Appendix E – Mitigation Measures:Section 5.6 – Working Within or Near Fish Bearing Watercourses;Section 5.8 – Temporary Watercourse Diversions;Section 5.9 – Fish Passage;Section 5.10 – Fish Salvage; andSection 5.11 – Bridge and Culvert Installation. | Yes |
| VC Subcomponent | Indicators | Project Phase | Project Component or Activity | Potential Effect | Key Mitigation Measures | Predicted Net Effect |
| Surface Water Quantity | Channel hydraulics (flow depth/water level and velocity) | Operations | Permanent waterbody crossings. | Change in surface water quantity | Waterbody crossings will be designed with single-span elements (bridges or culverts), where possible, to limit the encroachment of structures upon stream channels and minimize the effect on discharge for average flow conditions.Refer to Appendix E – Mitigation Measures:Section 5.6 – Working Within or Near Fish Bearing Watercourses;Section 5.8 – Temporary Watercourse Diversions;Section 5.9 – Fish Passage; andSection 5.11 – Bridge and Culvert Installation. | No |
| Surface Water Quantity | Erosion and sedimentation | Operations | Localized surface repairs and full granular resurfacing;Dust control;Control of vegetation/brush within the road ROW;Winter maintenance – snow clearing; andRoad drainage system maintenance. | Change in surface water quantity | The roadway and swales will be designed with consideration of low impact development procedures for linear infrastructure. These features include permanent enhanced swales that are designed to convey, treat, and attenuate stormwater runoff from the road.The road cross-fall will be designed to drain water after deterioration of the loose gravel road surface until seasonal maintenance operations crews return to reshape the roadway.Refer to Appendix E – Mitigation Measures:Section 5.1 – Clearing and Grubbing;Section 5.6 – Working Within or Near Fish Bearing Watercourses;Section 5.8 – Temporary Watercourse Diversions;Section 5.11 – Bridge and Culvert Installation;Section 5.16 – Erosion and Sediment Control; andSection 5.18 – Dust Control Practices. | No |
| Surface Water Quantity | Overland runoff drainage patterns | Operations | Localized surface repairs and full granular resurfacing;Control of vegetation/brush within the road right-of-way;Winter maintenance – snow clearing; andRoad drainage system maintenance. | Change in surface water quantity | Waterbody crossings will be designed with single-span elements (bridges or culverts), where possible, to limit the encroachment of structures into stream channels and thereby minimize the effect on discharge under variable flow conditions.The roadway and swales will be designed with consideration of low impact development procedures for linear infrastructure. These features include permanent enhanced swales that are designed to convey, treat, and attenuate stormwater runoff from the road.The road cross-fall will be designed to drain water after deterioration of the loose gravel road surface until seasonal maintenance operations crews return to reshape the roadway.Cross-culverts will be installed at regular intervals along the road (non-waterbody areas) within the lowlands/peatlands to convey surface drainage and movement subsurface groundwater flow through the road.Refer to Appendix E – Mitigation Measures:Section 5.1 – Clearing and Grubbing;Section 5.6 – Working Within or Near Fish Bearing Watercourses;Section 5.8 – Temporary Watercourse Diversions;Section 5.11 – Bridge and Culvert Installation; andSection 5.16 – Erosion and Sediment Control. | Yes |
| VC Subcomponent | Indicators | Project Phase | Project Component or Activity | Potential Effect | Key Mitigation Measures | Predicted Net Effect |
| Surface Water Quality | Concentration of suspended solids | Construction | Vegetation clearing and grubbingConstruction and use of support infrastructureConstruction of roadConstruction of permanent waterbody crossingsEmissions, discharges, and wasteClean-up and site restoration | Change in surface water quality | Clearing and grubbing will be limited to the current work area and will not be done in phased manner as the road construction advances to limit potential erosion and sedimentation.Sediment and erosion control measures will be implemented during the construction of the road and all support infrastructure.A Construction Waste Management Plan will be developed to minimize the amount of the waste to be generated, and the portion going to landfills or for incineration, by applying industry BMP including collection, recycling and disposal.Water quality monitoring will be conducted to demonstrate that deleterious substances are not entering waterbodies or watercourses. Monitoring will be conducted as per Section 7.10 (Follow-up and Monitoring), conditions of permits/approvals and as instructed by MNR and/or MECP prior to, during, and after in water construction activities in fish bearing watercourses and may be required when working near fish bearing watercourses.Refer to Appendix E – Mitigation Measures:Section 5.1 – Clearing and Grubbing;Section 5.3 – Spill Prevention and Emergency Response;Section 5.5 – Materials Handling and Storage;Section 5.6 – Working Within or Near Fish Bearing Watercourses;Section 5.7 – Temporary Watercourse Crossings;Section 5.8 – Temporary Watercourse Diversions;Section 5.11 – Bridge and Culvert Installation;Section 5.12 – Blasting Near a Watercourse;Section 5.18 – Dust Control Practices; andSection 5.22 – Water Quality Monitoring. | Yes |
| Surface Water Quality | Concentration of chemical constituents | Construction | Vegetation clearing and grubbing;Construction and use of support infrastructure;Dust control;Construction of road;Construction of permanent waterbody crossings;Emissions, discharges, and waste; andClean-up and site restoration. | Change in surface water quality | Clearing and grubbing will be limited to the current work area and will be done in phased manner as the road construction advances to limit erosion and sedimentation.Sediment and erosion control measures will be implemented during the construction of the road and all support infrastructure.A Construction Waste Management Plan will be developed to minimize the amount of the waste to be generated, and the portion going to landfills, by applying industry BMP including collection, recycling and disposal.Water quality monitoring will be conducted to demonstrate that deleterious substances are not entering waterbodies or watercourses. Monitoring will be conducted as per Section 7.10 (Follow-up and Monitoring), conditions of permits/approvals and as instructed by MNR and/or MECP prior to, during, and after in water construction activities in fish bearing watercourses and may be required when working near fish bearing watercourses or tributaries to fish bearing watercourses. | Yes |
| VC Subcomponent | Indicators | Project Phase | Project Component or Activity | Potential Effect | Key Mitigation Measures | Predicted Net Effect |
| Refer to Appendix E – Mitigation Measures:Section 5.1 – Clearing and Grubbing;Section 5.2 – Petroleum Handling and Storage;Section 5.3 – Spill Prevention and Emergency Response;Section 5.5 – Materials Handling and Storage;Section 5.6 – Working Within or Near Fish Bearing Watercourses;Section 5.7 – Temporary Watercourse Crossings;Section 5.8 – Temporary Watercourse Diversions;Section 5.11 – Bridge and Culvert Installation;Section 5.12 – Blasting Near a Watercourse;Section 5.17 – Concrete Washout Management Practices;Section 5.18 – Dust Control Practices; andSection 5.22 – Water Quality Monitoring. | ||||||
| Surface Water Quality | Erosion and sedimentation | Construction | Localized surface repairs and full granular resurfacing;Dust control;Control of vegetation/brush within the road right-of-way;Winter maintenance – snow clearing; andRoad drainage system maintenance. | Change in surface water quality | Erosion and Sediment Control measures (e.g., OPSS 805, Construction Specification for Temporary Erosion and Sediment Control Measures) will be incorporated into the detail design and implemented during construction to prevent erosion and migration of soils from the work site during rainfall events.Refer to Appendix E – Mitigation Measures:Section 5.1 – Clearing and Grubbing;Section 5.6 – Working Within or Near Fish Bearing Watercourses;Section 5.7 – Temporary Watercourse Crossings;Section 5.8 – Temporary Watercourse Diversions;Section 5.11 – Bridge and Culvert Installation;Section 5.16 – Erosion and Sediment Controls;Section 5.18 – Dust Control Practices;Section 5.19 – Aggregate Pit Decommissioning;Section 5.21 – Site Decommissioning and Rehabilitation; andSection 5.22 – Water Quality Monitoring. | No |
| Surface Water Quality | Concentration of suspended solids | Operations | Localized surface repair and full granular resurfacing;Dust control;Control of vegetation/brush within the road right-of-way;Winter maintenance – snow clearing; andRoad drainage system maintenance. | Change in surface water quality | The roadway and swales will be designed with consideration of low impact development procedures for linear infrastructure. These features include permanent enhanced swales that are designed to convey, treat, and attenuate stormwater runoff from the road.During operations, water from trucks will be applied to the gravel road surface along the east half of WSR in the peatlands and shoulders to control dust for safety of road users and to minimize potential impacts to the environment from the dispersal of air borne dust particles to adjacent natural areas.No application of sand or salt is proposed for de-icing of the WSR during the winter season based.An ongoing follow-up monitoring program (post-construction) will be implemented during the operations and maintenance phase of the Project.Refer to Appendix E – Mitigation Measures: | Yes |
| VC Subcomponent | Indicators | Project Phase | Project Component or Activity | Potential Effect | Key Mitigation Measures | Predicted Net Effect |
| Section 5.1 – Clearing and Grubbing;Section 5.3 – Spill Prevention and Emergency Response;Section 5.5 – Materials Handling and Storage;Section 5.6 – Working Within or Near Fish Bearing Watercourses;Section 5.11 – Bridge and Culvert Installation;Section 5.18 – Dust Control Practices; andSection 5.22 – Water Quality Monitoring. | ||||||
| Surface Water Quality | Concentration of chemical constituents | Operations | Localized surface repair and full granular resurfacing;Dust control;Control of vegetation/brush within the road right-of-way;Winter maintenance – snow clearing; andRoad drainage system maintenance. | Change in surface water quality | The roadway and swales will be designed with consideration of low impact development procedures for linear infrastructure. These features include permanent enhanced swales that are designed to convey, treat, and attenuate stormwater runoff from the road.During operations, water from trucks will be applied to the gravel road surface along the east half of WSR in the peatlands and shoulders to control dust for safety of road users and to minimize potential impacts to the environment from the dispersal of air borne dust particles to adjacent natural areas.No application of sand or salt is proposed for de-icing of the WSR during the winter season.An ongoing follow-up monitoring program (post-construction) will be implemented during the operations and maintenance phase of the Project.Refer to Appendix E – Mitigation Measures:Section 5.1 – Clearing and Grubbing;Section 5.2 – Petroleum Handling and Storage;Section 5.3 – Spill Prevention and Emergency Response;Section 5.5 – Materials Handling and Storage;Section 5.6 – Working Within or Near Fish Bearing Watercourses;Section 5.11 – Bridge and Culvert Installation;Section 5.18 – Dust Control Practices; andSection 5.22 – Water Quality Monitoring. | Yes |
| Surface Water Quality | Erosion and sedimentation | Operations | Localized surface repairs and full granular resurfacing;Dust control;Control of vegetation/brush within the road right-of-way;Winter maintenance – snow clearing; andRoad drainage system maintenance. | Change in surface water quality | The roadway and swales will be designed with consideration of low impact development procedures for linear infrastructure. These features include permanent enhanced swales that are designed to convey, treat, and attenuate stormwater runoff from the road.During operations, water from trucks will be applied to the gravel road surface along the east half of WSR in the peatlands and shoulders to control dust for safety of road users and to minimize potential impacts to the environment from the dispersal of air borne dust particles to adjacent natural areas.No application of sand or salt is proposed for de-icing of the WSR during the winter season.An ongoing follow-up monitoring program (post-construction) will be implemented during the operations and maintenance phase of the Project.Refer to Appendix E – Mitigation Measures:Section 5.1 – Clearing and Grubbing; | No |
| VC Subcomponent | Indicators | Project Phase | Project Component or Activity | Potential Effect | Key Mitigation Measures | Predicted Net Effect |
| Section 5.6 – Working Within or Near Fish Bearing Watercourses;Section 5.8 – Temporary Watercourse Diversions;Section 5.11 – Bridge and Culvert Installation;Section 5.16 – Erosion and Sediment Control;Section 5.18 – Dust Control Practices; andSection 5.22 – Water Quality Monitoring. | ||||||
| Sediment Quality | Fish habitat quality and extents | Construction | Vegetation clearing and grubbing;Construction and use of support infrastructure;Dust control;Construction of road;Construction of permanent waterbody crossings;Emissions, discharges, and waste; andClean-up and site restoration. | Change in sediment quality | Clearing and grubbing will be limited to the current work area and will be done in a phased manner as the road construction advances.Sediment and erosion control measures will be implemented during the construction of the road and all support infrastructure.A Construction Waste Management Plan will be developed to minimize the amount of the waste to be generated, and the portion going to landfills, by applying industry BMP including collection, recycling and disposal.Water quality monitoring will be conducted to demonstrate that deleterious substances are not entering waterbodies or watercourses. Monitoring shall be conducted as per Section 7.10 (Follow-up and Monitoring), conditions of permits/approvals and as instructed by MNR and/or MECP prior to, during, and after in water construction activities in fish bearing watercourses and may be required when working near fish bearing watercourses.Refer to Appendix E – Mitigation Measures:Section 5.1 – Clearing and Grubbing;Section 5.2 – Petroleum Handling and Storage;Section 5.3 – Spill Prevention and Emergency Response;Section 5.5 – Materials Handling and Storage;Section 5.6 – Working Within or Near Fish Bearing Watercourses;Section 5.7 – Temporary Watercourse Crossings;Section 5.8 – Temporary Watercourse Diversions;Section 5.11 – Bridge and Culvert Installation;Section 5.12 – Blasting Near a Watercourse;Section 5.17 – Concrete Washout Management Practices;Section 5.18 – Dust Control Practices; andSection 5.22 – Water Quality Monitoring. | Yes |
| Sediment Quality | Concentration of chemical constituents | Construction | Vegetation clearing and grubbing;Construction and use of support infrastructure;Dust control;Construction of road;Construction of permanent waterbody crossings;Emissions, discharges, and waste; andClean-up and site restoration. | Change in sediment quality | Clearing and grubbing will be limited to the current work area and will be done in phased manner as road construction advances to limit erosion and sedimentation.Sediment and erosion control measures will be implemented during the construction of the road and all support infrastructure.A Construction Waste Management Plan will be developed to minimize the amount of the waste to be generated, and the portion going to landfills, by applying industry BMP including collection, recycling and disposal.Water quality monitoring will be conducted to demonstrate that deleterious substances are not entering waterbodies or watercourses. Monitoring will be conducted as per Section 7.10 (Follow-up and Monitoring), conditions of permits/approvals and as instructed by MNR and/or MECP prior to, during, and | Yes |
| VC Subcomponent | Indicators | Project Phase | Project Component or Activity | Potential Effect | Key Mitigation Measures | Predicted Net Effect |
| after in water construction activities in fish bearing watercourses and may be required when working near fish bearing watercourses. Refer to Appendix E – Mitigation Measures:Section 5.1 – Clearing and Grubbing;Section 5.2 – Petroleum Handling and Storage;Section 5.3 – Spill Prevention and Emergency Response;Section 5.5 – Materials Handling and Storage;Section 5.6 – Working Within or Near Fish Bearing Watercourses;Section 5.7 – Temporary Watercourse Crossings;Section 5.8 – Temporary Watercourse Diversions;Section 5.11 – Bridge and Culvert Installation;Section 5.12 – Blasting Near a Watercourse;Section 5.17 – Concrete Washout Management Practices;Section 5.18 – Dust Control Practices; andSection 5.22 – Water Quality Monitoring. | ||||||
| Sediment Quality | Concentration of suspended solids | Construction | Vegetation clearing and grubbing;Construction and use of support infrastructure;Construction of road;Construction of permanent waterbody crossings;Waste discharge; andClean-up and site restoration. | Change in sediment quality | Clearing and grubbing will be limited to the current work area and will be done in a phased manner as the construction advances to limit erosion and sedimentation.Sediment and erosion control measures will be implemented during the construction of the road and all support infrastructure.A Construction Waste Management plan will be developed to minimize the amount of the waste to be generated, and the portion going to landfills, by applying industry BMP including collection, recycling and disposal.Water quality monitoring shall be undertaken to demonstrate that deleterious substances are not entering waterbodies or watercourses. Monitoring shall be undertaken as per Section 7.10 (Follow-up Monitoring), conditions of permits/approvals and as instructed by MNR and/or MECP prior to, during, and after in water construction activities in fish bearing watercourses and may be required when working near fish bearing watercourses or tributaries to fish bearing watercourses.Refer to Appendix E – Mitigation Measures:Section 5.1 – Clearing and Grubbing;Section 5.3 – Spill Prevention and Emergency Response;Section 5.5 – Materials Handling and Storage;Section 5.6 – Working Within or Near Fish Bearing Watercourses;Section 5.7 – Temporary Watercourse Crossings;Section 5.8 – Temporary Watercourse Diversions;Section 5.11 – Bridge and Culvert Installation;Section 5.12 – Blasting Near a Watercourse; andSection 5.18 – Dust Control Practices. | Yes |
| VC Subcomponent | Indicators | Project Phase | Project Component or Activity | Potential Effect | Key Mitigation Measures | Predicted Net Effect |
| Sediment Quality | Erosion and sedimentation | Construction | Vegetation clearing and grubbing;Construction and use of support infrastructure;Construction of road;Construction of permanent waterbody crossings; andClean-up and site restoration. | Change in sediment quality | Erosion and Sediment Control measures (e.g., OPSS 805, Construction Specification for Temporary Erosion and Sediment Control Measures) will be incorporated into the detail design and implemented during construction to prevent erosion and migration of soils from the work site during rainfall events.Refer to Appendix E – Mitigation Measures:Section 5.1 – Clearing and Grubbing;Section 5.6 – Working Within or Near Fish Bearing Watercourses;Section 5.7 – Temporary Watercourse Crossings;Section 5.8 – Temporary Watercourse Diversions;Section 5.11 – Bridge and Culvert Installation;Section 5.16 – Erosion and Sediment Control;Section 5.18 – Dust Control Practices;Section 5.19 – Aggregate Pit Decommissioning; andSection 5.21 – Site Decommissioning and Rehabilitation. | No |
| Sediment Quality | Concentration of suspended solids | Operations | Localized surface repair and full granular resurfacing;Dust control;Control of vegetation/brush within the road right-of-way; andRoad drainage system maintenance. | Change in sediment quality | The roadway and swales will be designed with consideration of low impact development procedures for linear infrastructure. These features include permanent enhanced swales that are designed to convey, treat, and attenuate stormwater runoff from the road.During operations water from trucks will be applied to the gravel road surface along the east half of WSR in the peatlands and shoulders to control dust for safety of road users and to minimize potential impacts to the environment from the dispersal of air borne dust particles to adjacent natural areas.No application of sand or salt is proposed for de-icing of the WSR during the winter season based.An ongoing follow-up monitoring program (post-construction) will be implemented during the operations and maintenance phase of the Project.Refer to Appendix E – Mitigation Measures:Section 5.1 – Clearing and Grubbing;Section 5.3 – Spill Prevention and Emergency Response;Section 5.5 – Materials Handling and Storage;Section 5.6 – Working Within or Near Fish Bearing Watercourses;Section 5.11 – Bridge and Culvert Installation;Section 5.18 – Dust Control Practices; andSection 5.22 – Water Quality Monitoring. | Yes |
| Sediment Quality | Concentration of chemical constituents | Operations | Localized surface repair and full granular resurfacing;Dust control;Control of vegetation/brush within the road right-of-way; andRoad drainage system maintenance. | Change in sediment quality | The roadway and swales will be designed with consideration of low impact development procedures for linear infrastructure. These features include permanent enhanced swales that are designed to convey, treat, and attenuate stormwater runoff from the road.During operations, water from trucks will be applied to the gravel road surface along the east half of WSR in the peatlands and shoulders to control dust for safety of road users and to minimize potential impacts to the environment from the dispersal of air borne dust particles to adjacent natural areas. | Yes |
| VC Subcomponent | Indicators | Project Phase | Project Component or Activity | Potential Effect | Key Mitigation Measures | Predicted Net Effect |
| No application of sand or salt is proposed for de-icing of the WSR during the winter season based.An ongoing follow-up monitoring program (post-construction) will be implemented during the operations and maintenance phase of the Project.Refer to Appendix E – Mitigation Measures:Section 5.1 – Clearing and Grubbing;Section 5.2 – Petroleum Handling and Storage;Section 5.3 – Spill Prevention and Emergency Response;Section 5.5 – Materials Handling and Storage;Section 5.6 – Working Within or Near Fish Bearing Watercourses;Section 5.8 – Temporary Watercourse Diversions;Section 5.11 – Bridge and Culvert Installation; andSection 5.18 – Dust Control Practices. | ||||||
| Sediment Quality | Erosion and sedimentation | Operations | Localized surface repairs and full granular resurfacing;Dust control;Control of vegetation/brush within the road right-of-way;Winter maintenance – snow clearing; andRoad drainage system maintenance. | Change in sediment quality | The roadway and swales will be designed with consideration of low impact development procedures for linear infrastructure. These features include permanent enhanced swales that are designed to convey, treat, and attenuate stormwater runoff from the road.During operations, water from trucks will be applied to the gravel road surface along the east half of WSR in the peatlands and shoulders to control dust for safety of road users and to minimize potential impacts to the environment from the dispersal of air borne dust particles to adjacent natural areas.No application of sand or salt is proposed for de-icing of the WSR during the winter season based.An ongoing follow-up monitoring program (post-construction) will be implemented during the operations and maintenance phase of the Project.Refer to Appendix E – Mitigation Measures:Section 5.1 – Clearing and Grubbing;Section 5.6 – Working Within or Near Fish Bearing Watercourses;Section 5.8 – Temporary Watercourse Diversions;Section 5.11 – Bridge and Culvert Installation;Section 5.16 – Erosion and Sediment Control;Section 5.18 – Dust Control Practices; andSection 5.22 – Water Quality Monitoring. | No |
7.5 Characterization of Net Effects
Net effects are defined as the effects of the Project that remain after application of proposed mitigation measures. Table 7-15 presents definitions for net effects criteria, developed with specific reference to Surface Water Resources VC. These criteria are considered together in the assessment, along with context derived from existing conditions and proposed mitigation measures, to characterize predicted net effects from the Project on Surface Water Resources VC.
Table 7-15: Criteria for Characterization of Predicted Net Effects on Surface Water Resources VC
| Characterization Criteria | Description | Quantitative Measure or Definition of Qualitative Categories |
| Direction | Direction relates to the value of the effect in relation to the existing conditions. | Positive – Net gain or benefit; effect is desirable. Neutral – No change compared with baseline conditions and trends. Negative – Net loss or adverse effect; effect is undesirable. |
| Magnitude | Magnitude is the amount of change in measurable parameters or the VC relative to existing conditions. | Negligible – No measurable change. Low – A measurable change that is at the upper limits or slightly exceed the characteristic range of existing conditions or guideline values. Moderate – A measurable change that is above the characteristic range of existing conditions and guideline values but does not adversely affect sensitive species. High – A measurable change that is substantially above the characteristic range of existing conditions and guideline values and has potential to adversely affect sensitive species. |
| Geographic Extent | Geographic extent refers to the spatial area over which a net effect is expected to occur or can be detected within the Project Footprint, Local Study Area (LSA), or Regional Study Area (RSA). | Project Footprint – The effect is confined to the Project Footprint. Local Study Area – The effect is confined to the LSA. Regional Study Area – The effect extends beyond the LSA boundary but is confined within the RSA. |
| Timing | Timing criteria indicate the timing (e.g., dates or seasons) importance of the net effect relative to the restricted activity timing window, and seasonal conditions. | Within Restricted Activity Timing Window to protect fish/fish habitat – effect occurs during the potential restricted activity timing windows as specified by MNR and DFO, such that potential effects to fish and fish habitat may occur. Outside Restricted Activity Timing Window to protect fish/fish habitat – effect occurs outside the potential restricted activity timing windows as specified by MNR and DFO, such that potential effects to fish and fish habitat are reduced. |
| Characterization Criteria | Description | Quantitative Measure or Definition of Qualitative Categories |
| Duration | Duration is the period of time required until the measurable indicators or the VC returns to its existing (baseline) condition, or the net effect can no longer be measured or otherwise perceived. | Short-Term – Net effect restricted to no more than the duration of the construction phase (approximately 5 years). Medium-Term – Net effect extends through the Operations Phase of the Project (75-year life cycle). Long-Term – Net effect extends beyond the Operations Phase (greater than 75 years). Permanent – Recovery to baseline conditions unlikely. |
| Frequency | Frequency refers to the rate of occurrence of an effect over the duration of the Project or in a specific phase. | Infrequent – The effect is expected to occur rarely. Frequent – The effect is expected to occur intermittently. Continuous – The effect is expected to occur continually. |
| Context | Context considers sensitivity and resilience of the VC to project related change. | Low resilience – Subcomponent has low resilience or ability to adapt to changes in the indicator and is susceptible to potential changes caused by the Project. Moderate resilience – Subcomponent has a moderate resilience or ability to adapt to changes in the indicator and has moderate susceptibility to potential changes caused by the Project. High resilience – Subcomponent has high resilience or ability to adapt to changes in the measurement indicator and low susceptibility to changes caused by the Project. |
| Input from Indigenous Peoples | Views of the Indigenous communities and groups in assigning the criteria to be used and in characterizing the effects. | Not applicable – No inputs were received during the engagement and consultation. |
| Reversibility | Reversibility describes whether a measurable indicator or the VC can return to its existing condition after the project activity ceases. | Reversible – The net effect is likely to be reversed after activity completion and rehabilitation. Irreversible – The net effect is unlikely to be reversed. |
| Likelihood of Occurrence | Likelihood of occurrence is a measure of the likelihood that an activity will result in an effect. | Unlikely – The effect is not likely to occur. Possible – The effect may occur, but is not likely. Probable – The effect is likely to occur. Certain – The effect will occur. |
7.5.1 Potential Effect Pathways Not Carried Through for Further Assessment
Potential effect pathways that are expected to be eliminated through the implementation of mitigation measures include the following:
- Introduction of airborne particulate matter from construction and maintenance activities
- Erosion and sedimentation associated with construction activities
The construction phase is anticipated to include activities that could disburse airborne particulate matter into nearby waterbodies. These activities are expected to be localized, temporary, and short in duration and affect a small spatial extent within the LSA. Airborne particulate matter is not anticipated to affect surface water quality during the operations phase. With implementation of mitigation measures such as dust control measures (refer to Section 5.18 – Dust Control Practices in Appendix E – Mitigation Measures), the net effect of airborne particulate matter on surface water quality is anticipated to be negligible (refer to Section 9 – Assessment of Effects on Atmospheric Environment) and is therefore not carried forward for further assessment.
The construction phase is anticipated to included activities that could result in increased erosion and sedimentation that subsequently lead to increased suspended solids and particulate matter entering waterbodies. Construction activities will be controlled with the implementation of mitigation measures (refer to Section 5.16 – Erosion and Sediment Control in Appendix E – Mitigation Measures) to limit the extent of erosion and prevent sediment from reaching waterbodies.
The net effect of erosion and sedimentation is anticipated to be negligible and is therefore not carried forward for further assessment.
Potential net effects that remain following the implementation of mitigation measures are carried forward for further assessment (Section 7.5.2).
7.5.2 Predicted Net Effects
An effect on the Surface Water Resources VC may remain after the implementation of mitigation measures. The determination of whether a net effect is considered significant is described in Section 7.6. The predicted net effects include:
- Change in surface water quantity due to:
- Short-term water takings for construction and operations such as dust suppression, water use for camps, and dewatering;
- Short-term discharges of construction water, wastewater, or wash water into surface waterbodies;
- Alterations to land cover resulting in changes to runoff rates, runoff volumes, infiltration rates, and overland flow paths;
- Installation of culverts and bridges resulting in alteration of discharge rates and flow paths at waterbody crossings;
- Permanent waterbody crossings leading to changes in local hydraulics (flow depth/water level and velocity); and
- Road maintenance resulting in changes to overland runoff drainage patterns.
- Changes in surface water quality due to:
- Short-term discharges of construction water, wastewater, or wash water that have different quantities of chemical constituents or suspended solids from the receiving waterbody;
- Blasting activities releasing chemical constituents into nearby waterbodies; and
- Road maintenance activities leading to the deposition of sediment into waterbodies.
- Changes in sediment quality due to:
- Short-term discharges of construction water, wastewater, or wash water that have different quantities of chemical constituents or suspended solids from the receiving waterbody;
- Blasting activities releasing chemical constituents into nearby waterbodies; and
- Road maintenance activities leading to the deposition of sediment into waterbodies.
7.5.2.1 Change in Surface Water Quantity
Short-term water takings for construction and operations are predicted to result in reduced streamflow or water levels in nearby waterbodies. The spatial extents of the change in water quantity would be limited to the waterbody and watershed from which the water is taken. This would be more noticeable within the LSA and downstream of the ROW. The direction of the effect is negative because there would be a change from normal conditions by reducing water in streams and waterbodies. The magnitude of the change is expected to be low because limitations and restrictions will be applied to where, when, and how much water can be used for construction and operations to avoid adverse effects to water levels. The timing of the effects may be within or outside the restricted activity timing window during construction to protect fish/fish habitat (refer to Section 7.4) and in the summer for operations when dust suppression is required. The duration of the effects will be short-term and limited to within the periods that water takings occur. The effect is expected to occur frequently during construction and infrequently during operations. The waterbodies have high resilience to this effect because of the mitigation measures and limitations applied to water takings. The likelihood of occurrence is certain because short-term water takings will be required for construction. However, the net effect is reversible and water levels and stream flows would return to pre-construction levels shortly after the termination of water takings, depending on weather and the change of seasons.
Short-term discharges of construction water, wastewater, or wash water would result in increased streamflow or water levels in nearby waterbodies. The spatial extents of the change in water quantity would be limited to the receiving watershed. This would be more noticeable within the LSA and downstream of the ROW. The direction of the effect is negative because there would be a change to normal conditions by increasing water in streams and waterbodies. The magnitude of the change is expected to be low because limitations and restrictions will be applied to where, when, and how much water can be discharged. The timing of the effects would primarily be outside the restricted activity timing window during construction to protect fish/fish habitat (refer to Section 7.4). The duration of the effects will be
short-term and limited to within the periods that water is discharged. The effect is expected to occur frequently during construction. The waterbodies have high resilience to this effect because of the mitigation measures and limitations applied to discharges. The likelihood of occurrence is certain because short-term discharges will be required for construction. However, the net effect is reversible and water quantity should return to pre-construction levels within a year or less, depending on weather and the change of seasons.
Changes to runoff rates and runoff volumes due to changes in land cover in the Project Footprint would result in reduced infiltration and increased streamflow or water levels during construction and operations. The spatial extents of changes to infiltration would be limited to the Project Footprint and changes to runoff rates and volumes would be limited to the LSA. The direction of the effect is negative because there would be a change to normal conditions by increasing water in streams and waterbodies and reducing groundwater recharge rates. The frequency and magnitude of flooding in the LSA could increase because of the increased runoff. The magnitude of changes is expected to be low
because the relative area of modified catchment is much smaller than the total catchment areas of local watersheds. This effect may occur within or outside the restricted activity timing window to protect fish/fish habitat during construction and operations. The net effect would have a long-term duration because the land cover change will remain during operations of the road. However, construction laydowns will be temporary and the extents of change in land cover will be limited through mitigation measures. The effect is expected to occur continuously and the receiving waterbodies have a high resilience to changes of this magnitude. The effect is reversible and the likelihood of occurrence is certain during construction and operations.
- Installation of waterbody crossing structures leading to temporary changes to discharge rates upstream or downstream of waterbody crossings
Construction of waterbody crossing structures would temporarily change discharge rates in the local waterbody. The effect would be negative because stream discharge will increase or decrease in local areas and change from normal flow conditions. The extent of the change would be limited to the LSA and short-term outside the restricted activity timing window for fish/fish habitat (refer to Section 7.4). The magnitude of the change is expected to be low because construction of permanent and temporary waterbody crossing structures will be timed for low-flow conditions to minimize the effect of temporary diversions on stream discharge. The occurrence of the effect would be infrequent and would be more likely to occur after large precipitation events and probable to occur during construction. The receiving waterbodies would be highly resilient to changes with the implementation of mitigation measures, and the effect is reversible.
- Permanent waterbody crossings leading to changes in local hydraulics (flow depth/water level and velocity)
Changes to local hydraulics (flow depth/water level and velocity) at and around constructed waterbody crossings could result in an increase or reduction of local shear stress, erosion, water levels, and sedimentation upstream or downstream of the crossings during the operations phase. The direction of the effect is negative because any change to depth and velocity could result in adverse consequences and the spatial extents would be limited to the waterbody near the crossing and LSA. The magnitude of the change is expected to be low because the waterbody crossings are designed to pass lower bankfull floods without velocity or water level changes and higher peak design floods with limited velocity and water level changes. Design mitigation will be incorporated to crossings that require skewed structures to minimize adverse changes to flow depth/water level and velocity for streams that run parallel to the road for short distances. Erosion will be mitigated through the engineering design of waterbody crossing inlets and outlets.
These effects may occur within or outside the restricted activity timing window to protect fish/fish habitat and are infrequent following large melt or precipitation events. The effects could occur anytime in the long-term while the waterbody crossings are in place. The waterbodies would have a high resilience to these changes and would be reversible after rehabilitation. The likelihood of occurrence is certain.
Changes in overland flow paths due to road drainage system maintenance, winter snow clearing, localize road surface repairs, and vegetation control would result in an increased or decreased streamflow or water levels in the local receiving bodies. The spatial extents are limited to the LSA and the direction of the effect is negative because an increase to runoff in areas could result in erosion and sedimentation while a decrease in water recharge could be detrimental to sensitive habitat. The magnitude of the change is expected to be low because of mitigation measures such as waterbody crossings and cross-culverts to maintain existing overland flow paths as much as possible. The effect would continue in the medium-term throughout the operations phase while maintenance activities are ongoing. The timing of changes may be within or outside the restricted activity timing window to protect fish/fish habitat. The effect would be expected to occur continuously and the receiving system would have a high resilience to changes. The change would be reversible after rehabilitation and certain to occur.
7.5.2.2 Change in Surface Water Quality
Short-term discharges of construction water, wastewater, or wash water could result in increased chemical constituents and exceedances of water quality guidelines in nearby waterbodies. The spatial extents of the change in water quality would be limited to the receiving waterbody and downstream watershed. The magnitude of the change in quality would decrease over time and distance from the discharge. The direction of the effect is negative because an increase to chemical constituents in streams and waterbodies may adversely affect fish, fish habitats, vegetation, and wetlands.
The magnitude of the change is expected to be low because limitations and restrictions will be applied to where, when, and how much water can be discharged. The effects would primarily be outside the restricted activity timing window to protect fish/fish habitat during construction (refer to Section 7.4). The duration of the effects will be short-term because discharges will be limited to only occur during construction phase. The effect is expected to occur frequently during construction. The waterbodies have high resilience to this effect because of the mitigation measures and limitations applied to discharges. The likelihood of occurrence is possible because short-term discharges will be required for construction, but concentrations of chemical constituents may be low and not reduce water quality. The net effect is reversible and water quality should return to pre-construction levels shortly after the termination of water discharges, depending on weather and the change of seasons.
Blasting activities could release chemicals and sediment into nearby waterbodies through airborne particulate or runoff. As a result, water quality guidelines could be exceeded. The spatial extents would be limited to the waterbodies in close proximity to blasting activities and downstream watersheds. The direction of the effect is negative because there could be an increase to chemical constituents and turbidity in streams and waterbodies resulting in potential adverse effects to fish, fish habitats, vegetation, and wetlands. The magnitude of the changes is expected to be low because the timing of blasting near a watercourse will be constrained to outside the restricted activity timing window and transport of released chemicals will be minimized through erosion and sediment control measures (refer to Section 7.4 of this EAR/IS, Section 5.12 – Blasting Near a Watercourse in Appendix E – Mitigation Measures, and Section 5.16 – Erosion and Sediment Control in Appendix E – Mitigation Measures). The effects would be infrequent and short-term in duration around the timing of blasting activities. The likelihood of occurrence is probable and the effects would be reversible.
Road drainage system maintenance, winter snow clearing, localize road surface repairs, and vegetation control could result in deposition of sediment into nearby waterways and changes to water chemistry. The spatial extents are limited to the LSA and the direction of the effect is negative because there could be an increase to chemical constituents and turbidity in streams and waterbodies resulting in potential adverse effects to fish, fish habitats, vegetation, and wetlands. The effect may occur within or outside the restricted activity timing window to protect fish/fish habitat and would continue in the medium-term throughout the operations phase. The magnitude of the effect is predicted to be low and to occur on a frequent basis. The receiving waterbodies are expected to have a high resilience relative to the magnitude of the effect and the effect is reversible after the completion of operations. The likelihood of occurrence is probable because maintenance activities will be ongoing, although concentrations of chemical constituents may be low and not reduce water quality.
7.5.2.3 Change in Sediment Quality
Effect from short-term discharges via runoff from construction water, wastewater, or wash water could increase pollutants entering the waterways and depositing as sediment. Spatial extents will be contingent on the characteristics of transported suspended sediment via runoff but limited to the LSA. Fine suspended sediment has the potential to travel beyond the directly impacted areas. The direction of effect is negative because increased chemical constituents and total suspended solids concentrations may adversely affect fish, fish habitats, vegetation, and wetlands. The magnitude of changes is negligible due to the imposition of restrictions and limitations on the location, timing, and volume of water discharge as runoff. The duration of the effects will be short-term, occurring during construction phase. The likelihood of occurrence is possible because short-term discharges will be necessary for construction, although concentrations of chemical constituents may be low and not reduce sediment quality. The net effect is reversible, and sediment quality should return to pre-construction levels within a year and with the changing seasons, depending on the weather.
Blasting activities may result in an increase in chemical constituents and exceedances of sediment quality guidelines. Explosive spills and residues could runoff into surface waterbodies, settling as sediment, impacting fish habitat and sediment quality. Spatial extents would be limited to the active blasting area, determined by the features of the chemical constituents and the settlement of suspended matter. Direction of effect is negative resulting in increase of chemical constituents or suspended solids resulting in potential adverse effects to fish, fish habitat, vegetation, and wetlands; however, sediment deposition would be limited to the proximity to blasting activities and downstream watersheds.
Magnitude of changes is expected to be low due to the low potential of an increase in chemical constituents surpassing sediment quality guidelines. Blasting activities are limited to the construction phase and short durations, with anticipated return to normal chemical concentrations after construction. The timing of blasting will be constrained to outside the restricted activity timing window and transport of released chemicals will be minimized through erosion and sediment control measures (refer to Section 7.4 of this EAR/IS, Section 5.12 – Blasting Near a Watercourse in Appendix E – Mitigation Measures, and Section 5.16 – Erosion and Sediment Control in Appendix E – Mitigation Measures). The effects would be infrequent and short-term in duration around the timing of blasting activities. The likelihood of occurrence is probable, and the effects would be reversible.
Road drainage system maintenance, winter snow clearing, localize road surface repairs, and vegetation control could result in deposition of sediment into nearby waterways. The spatial extents are limited to the LSA and the direction of the effect is negative because there could be an increase to chemical constituents in sediment and waterbodies resulting in potential adverse effects to fish, fish habitats, vegetation, and wetlands. The effect may occur within or outside the restricted activity timing window to protect fish/fish habitat and would continue in the medium-term throughout the operations phase. The magnitude of the effect is predicted to be low and to occur on a frequent basis. The receiving waterbodies are expected to have a high resilience relative to the magnitude of the effect and the effect is reversible after the completion of operations. The likelihood of occurrence is probable because maintenance activities will be ongoing, although concentrations of chemical constituents may be low and not reduce sediment quality.
7.5.3 Summary
A summary of the characterization of predicted net effects is provided in Table 7-16.
Table 7-16: Summary of Predicted Net Effects on Surface Water Resources VC
| Predicted Net Effect | Project Phase | Net Effects Characterization | ||||||||
| Direction | Magnitude | Geographic Extent | Timing | Duration | Frequency | Context | Reversibility | Likelihood of Occurrence | ||
| Change in Surface Water Quantity | ||||||||||
| Reduced stream flow or water level due to short- term water takings | Construction and Operations | Negative | Low | LSA, RSA | Within / Outside Restricted Activity Timing Window | Short-Term | Frequent / Infrequent | High Resilience | Reversible | Certain |
| Increased stream flow or water level due to short- term discharges | Construction | Negative | Low | LSA, RSA | Outside Restricted Activity Timing Window | Short-Term | Frequent | High Resilience | Reversible | Certain |
| Changes to infiltration and runoff due to changes in land cover | Construction and Operations | Negative | Low | Project Footprint, LSA | Within / Outside Restricted Activity Timing Window | Long-Term | Continuous | High Resilience | Reversible | Certain |
| Changes to discharge rates during installation of water crossings | Construction | Negative | Low | LSA | Outside Restricted Activity Timing Window | Short-Term | Infrequent | High Resilience | Reversible | Probable |
| Changes to channel hydraulics (flow depth/water level and velocity) | Operations | Negative | Low | LSA | Within / Outside Restricted Activity Timing Window | Long-Term | Infrequent | High Resilience | Reversible | Certain |
| Predicted Net Effect | Project Phase | Net Effects Characterization | ||||||||
| Direction | Magnitude | Geographic Extent | Timing | Duration | Frequency | Context | Reversibility | Likelihood of Occurrence | ||
| around constructed water crossings | ||||||||||
| Changes to overland flow paths due to road maintenance activities | Operations | Negative | Low | LSA | Within / Outside Restricted Activity Timing Window | Medium- Term | Continuous | High Resilience | Reversible | Certain |
| Change in Surface Water Quality | ||||||||||
| Increased chemical constituents due to short- term discharges | Construction | Negative | Low | LSA, RSA | Outside Restricted Activity Timing Window | Short-Term | Frequent | High Resilience | Reversible | Possible |
| Chemical and sediment release from blasting activities | Construction | Negative | Low | LSA, RSA | Outside Restricted Activity Timing Window | Short-Term | Infrequent | High Resilience | Reversible | Probable |
| Deposition of sediment into waterbodies from road maintenance activities | Operations | Negative | Low | LSA | Within / Outside Restricted Activity Timing Window | Medium- Term | Frequent | High Resilience | Reversible | Probable |
| Predicted Net Effect | Project Phase | Net Effects Characterization | ||||||||
| Direction | Magnitude | Geographic Extent | Timing | Duration | Frequency | Context | Reversibility | Likelihood of Occurrence | ||
| Change in Sediment Quality | ||||||||||
| Increased chemical constituents in sediment due to short- term discharges | Construction | Negative | Low | LSA | Outside Restricted Activity Timing Window | Short-Term | Frequent | High Resilience | Reversible | Possible |
| Increased chemical constituents in sediment due to blasting activities | Construction | Negative | Low | LSA | Outside Restricted Activity Timing Window | Short-Term | Infrequent | High Resilience | Reversible | Probable |
| Deposition of sediment into waterbodies from road maintenance activities | Operations | Negative | Low | LSA | Within / Outside Restricted Activity Timing Window | Medium- Term | Frequent | High Resilience | Reversible | Probable |
Note: Refer to Table 7-15 for definitions of categories for net effect characterization
7.6 Determination of Significance
Significant effects are those of sufficient magnitude, spatial extent, duration, frequency, irreversibility and likelihood to cause a change in the environment beyond an acceptable standard.
Adverse consequences resulting from changes to water quantity would include:
- Alteration of water flow in the RSA caused by project activities, leading to the inundation of waterbodies or land;
- Disruption to the operational balance of waterbodies, affecting habitats, ecology, and human activities, such as recreation, navigation, and traditional practices that include fishing, hunting, and trapping;
- Loss of fish habitat from connecting waterbodies that are unaccounted for through compensation; and
- Increased erosion and sedimentation to levels above regulatory standards.
Adverse consequences resulting from changes to water quality would include:
- Increased concentration of chemical contaminants that lead to acute or chronic toxicity for aquatic life; and
- Disruption to the operational balance of waterbodies, affecting habitats, ecology, and human activities, such as drinking water and traditional practices that include fishing, hunting, and trapping.
Adverse consequences resulting from changes to sediment quality would include:
- Increased concentration of chemical contaminants that lead to acute or chronic toxicity for aquatic life including benthic invertebrate;
- Increased erosion and sedimentation to levels above regulatory standards;
- Increased suspended sediment in the water column can lead to reduced light penetration, inhibiting photosynthesis and negatively impacting aquatic plants and habitats; and
- The presence of excessive sediment can be challenging to obtain clean drinking water for human consumption.
Several methodologies can be used to determine whether an adverse environmental effect is significant or not significant, as outlined in the Interim Technical Guidance Determining Whether a Designated Project is Likely to Cause Significant Adverse Environmental Effects under the Canadian Environmental Assessment Act (CEA Agency, 2018). A qualitative aggregation method is used for determination of significance based on the sequential interaction among the magnitude, geographic extent, duration, frequency, reversibility, and likelihood of occurrence criteria for effects. The following sequential interactions form the basis for determination of significance of adverse net effects on Surface Water Resources VC:
- A predict net effects is considered not significant if the effect is:
- Low to moderate in magnitude, local to regional in extent, short-term to permanent in duration, infrequent to continuous occurrence, reversible to irreversible in nature, and unlikely to certain to occur.
- A predict net effects is considered significant if the effect is:
- Moderate to high in magnitude, regional in extent, long-term to permanent in duration, continuous in occurrence, irreversible in nature, and probable (likely) or certain to occur.
7.6.1 Surface Water Quantity
Mitigation measures through engineering design and construction management practices are proposed to minimize the impact of the Project on water quantity. Alteration of water flow in the RSA will be limited by installing water crossings that are sufficiently sized to pass frequent floods and accommodate potential use of navigable waterways. Construction of water crossing structures will be timed during low-flow conditions and outside the restricted activity period to minimize impact on fish habitat and the effect of temporary diversions on stream discharge. Erosion and sediment control measures will be implemented and maintained throughout construction that include, but are not limited to, sediment fences, sedimentation ponds, check dams, and erosion control fabric. The net effects on surface water quantity are of low magnitude and predicted to be not significant.
7.6.2 Surface Water Quality
Local water quality within the LSA may experience increases of potential contaminant of concerns above MOE PWQOs, CCME CEQGs and GCDWQ; however, these changes are expected to be of low magnitude and contained within the boundaries of the LSA. With mitigation and environmental protection measures applied, the net effects on the surface water quality are of low magnitude and predicted to be not significant.
Background concentrations were typically below water quality guidelines for all parameters with the exception of iron, aluminum, and manganese and other temporal outliers. The regular exceedance of manganese was related to the drinking water quality guidelines and the guideline for aquatic life was not exceeded. The drinking water guideline is for treated drinking water and is a more stringent criteria that should just be considered as a guide in the absence of other criteria. The aluminum guideline exceedances were primarily due to pH threshold being lower than 6.5 in field samples and was not highlighted as a significant concern. Exceedances of the iron guideline were the most common; however, the net effects of project activities to iron concentrations are not predicted to be significant.
7.6.3 Sediment Quality
Local sediment quality within Winisk River, Ekwan River, and Attawapiskat River watersheds may experience increases of potential contaminant of concerns above one or more of the CCME PEHH, ISQG and MOE LEL; however, these changes are expected to be of low magnitude and contained within the boundaries of the LSA. With mitigation and environmental protection measures applied, the net effects on the sediment quality are of low magnitude and predicted to be not significant.
7.7 Cumulative Effects
In addition to assessing the net environmental effects of the Project, the assessment for Surface Water Resources VC also evaluates and assesses the significance of net effects from the Project that overlap temporally and spatially with effects from other past, present and reasonably foreseeable developments (RFDs) and activities (i.e., cumulative effects).
For a valued component that has identified net effects where the magnitude was determined to be higher than negligible, it is necessary to determine if the effects from the Project interact both temporally and spatially with the effects from one or more past, present RFDs or activities, since the combined effects may differ in nature or extent from the effects of individual project activities. Where information is available, the cumulative effects assessment estimates or predicts the contribution of effects from the Project and other human activities on the criteria, in the context of changes to the natural, health, social or economic environments.
For this Surface Water Resources VC assessment, the net effects in Section 7.5 that are characterized as having a likelihood of occurrence of “probable” or “certain” and a “low” to “high” magnitude have been carried forward to the cumulative effects assessment. Net effects with this characterization are most likely to interact with other RFD and activities.
The cumulative effects assessment for the Project is completed at the regional scale (i.e., VC specific RSA). The cumulative effects assessment for each VC is primarily qualitative and describes how the interacting effects of human activities and natural factors are predicted to affect indicators for each VC. The assessment is presented as a reasoned narrative describing the outcomes of cumulative effects for each VC.
The predicted net effects of the Project on the Surface Water Resources VC that are carried forward for the assessment of cumulative effects within the Surface Water Resources RSA include:
- Change in surface water quantity; and
- Change in surface water quality.
Results of the cumulative effects assessment for the Surface Water Resources VC with consideration of RFDs and activities are presented in Section 21.
7.8 Prediction Confidence in the Assessment
The level of confidence in the effects assessment for surface water resources is moderate. The uncertainty in the prediction confidence is primarily associated with limited data availability for stream discharges and sparse climate data relative to the size of the LSA and RSA. There is also a high degree of uncertainty linked with climate change predictions in the long-term. Proven mitigation methods will be used to increase the level of confidence while conservative design approaches and professional judgement were used to account for higher uncertainty in-stream discharges.
Effects on water quantity are assessed based on runoff characterization at all identified waterbody crossings. Peak discharge estimates at the waterbody crossing locations were calculated using three methods discussed in Section 7.2 and in Appendix F – NEEC Report. The MIFM was selected as the most appropriate based on the limited availability of data in the project study areas. Climate change poses a high uncertainty to future peak discharges during the lifespan of the Project. Conservative assumptions were made adjusting peak discharges to account for climate change, and it is likely that environmental effects of the Project on water quantity are less than predicted. Potential effects on water quantity are addressed through standard and site-specific mitigation measures as discussed in Section 7.4.
Effects on water quality are predicted to be of low magnitude resulting from short-term discharges, blasting activities, and erosion and sedimentation. Water quality sample data were collected from major crossings and will be used in conjunction with an environmental monitoring plan to compare water quality conditions post-construction and during operations. The moderate confidence level is attributed to the complexity inherent in predicting the magnitude of effects, considering the dynamic nature of surface runoff patterns and potential influences on water quality. The Project does not include the release or diversion of any substantial water sources and mitigation measures are planned for accidental release of chemicals.
Effects on sediment quality are predicted to be of low magnitude resulting from long-term alterations to land cover (roadway surface), soil disturbance, blasting activities, stockpile material handling, road traffic, and general erosion and sedimentation. Sediment quality sample baseline data were collected at select locations along the major crossings and will be used in conjunction with an environmental monitoring plan to compare sediment quality conditions post- construction and during operations. The moderate confidence level is influenced by the inherent challenge in precisely
predicting the magnitude of effects, given the complexity of long-term alterations to land cover and potential influences on sediment quality. The Project does not involve the release or diversion of any substantial water sources that would lead to considerable surface runoff and erosion of sediments. Surface runoff is mostly caused by intermittent and seasonal precipitation as well as the melting of snow. Mitigation measures are designed to prevent erosion and sedimentation.
7.9 Predicted Future Condition of the Environment if the Project Does Not Proceed
The Project lies within un-surveyed/un-developed Ontario Crown lands and Webequie First Nation Reserve lands. There are existing mineral exploration activities (particularly near the east end of the proposed WSR) and it is predicted/assumed that there will be other proposed future mining developments in the area, which is referred to as the Ring of Fire area. Therefore, it is likely that other road construction projects would occur to support the current and future mining activities in the Ring of Fire area if this Project would not proceed.
Future road construction projects are anticipated to have similar effects on surface water resources. Without construction of the proposed WSR, the anticipated future state of surface water resources is expected to remain largely consistent with the existing conditions described in Section 7.2. However, it is important to note that surface water resources may undergo changes over time due to the impacts of climate change.
7.10 Follow-Up and Monitoring
| The Project invites community members to participate in developing and implementing programs, which includes water quality monitoring programs. |
| Indigenous community members will have an active role in developing and implementing management plans. |
The purposes of the follow-up and monitoring programs are to:
- Verify environmental effects predictions made during the EA/IA for the Project;
- Provide data with which to evaluate the effectiveness of mitigation measures and modify or enhance these measures, where necessary;
- Provide data with which to implement adaptive management measures for improving future environmental protection activities;
- Document additional measures of adaptive measures to improve future environmental protection activities; and
- Document compliance with required conditions as stipulated in permits, approvals, licenses and/or authorizations.
The recommended monitoring program related to Surface Water Resources VC are described as follows:
- Qualified environmental inspector(s) should be appointed to guide implementation, monitor, and report on the effectiveness of the construction procedures and mitigation measures.
- Surface water quality and sediment quality should be monitored, documented, and reported according to terms and conditions of the approved water taking permit (e.g., PTTW or EASR) and others permits, if applicable.
- Continue surface water sampling on a seasonal basis (e.g., spring, summer and fall) and sediment sampling on an annual basis at representative water body crossings. The monitoring and sampling programs will span pre-, during and post-construction periods (e.g., three years after construction is complete).
For more details on proposed water quality monitoring programs, refer to Section 5.22 (Water Quality Monitoring) in Appendix E – Mitigation Measures. Additional details on the proposed follow-up and monitoring for the Project are described in Section 22 of this EAR/IS, Follow-up and Compliance Monitoring Programs.
7.11 References
Canadian Council of Ministers of the Environment (CCME). 1999. Canadian Sediment Quality Guidelines for the Protection of Aquatic Life. Available at: https://ccme.ca/en/res/protocol-for-the-derivation-of-canadian-sediment- quality-guidelines-for-the-protection-of-aquatic-life-en.pdf
Canadian Council of Ministers of the Environment (CCME). 1999. Canadian Soil Quality Guidelines for the Protection of Environmental and Human Health. Available at: https://support.esdat.net/Environmental%20Standards/canada/soil/rev_soil_summary_tbl_7.0_e.pdf
Canadian Council of Ministers of the Environment (CCME). 2004. Canadian Water Quality Guidelines (CWQG) for the Protection of Aquatic Life: Phosphorus: Canadian Guidance Framework for the Management of Freshwater Systems. Winnipeg. 6 pp.
Canadian Council of Ministers of the Environment (CCME). 2023. Canadian Environmental Quality Guidelines.
Available at: https://ccme.ca/en/current-activities/canadian-environmental-quality-guidelines.
Canadian Environmental Assessment (CEA) Agency. 2018. Interim Technical Guidance Determining Whether a Designated Project is Likely to Cause Significant Adverse Environmental Effects under the Canadian Environmental Assessment Act. Available at: https://www.canada.ca/en/impact-assessment- agency/services/policy-guidance/determining-project-cause-significant-environmental-effects-ceaa2012.html
Impact Assessment Agency of Canada (IAAC). 2020. Webequie Supply Road Project Tailored Impact Statement Guidelines.
Ministry of the Environment, Conservation and Park (MECP), 2008. Guidelines for Identifying, Assessing And Managing Contaminated Sediments in Ontario: An Integrated Approach. Available at: https://www.publications.gov.on.ca/guidelines-for-identifying-assessing-and-managing-contaminated- sediments-in-ontario-an-integrated-approach-may-2008
MECP. 2019. Ring of Fire Environmental Monitoring Program. Preliminary Report. Report Updated October 2019. MNP LLP. 2023. Weenusk First Nation Existing Conditions Report – Webequie Supply Road Project. Prepared for
Weenusk First Nation.
Noront Resources Ltd. (Noront EA). 2013. A Federal/Provincial Environmental Impact Statement/Environmental Assessment Report.
Ontario Ministry of Environment (MOE). 2011. Soil, ground water and sediment standards for use under Part XV.1 of the Environmental Protection Act. Available at: https://www.ontario.ca/page/soil-ground-water-and-sediment- standards-use-under-part-xv1-environmental-protection-act
Ontario Ministry of Environment and Energy (MOEE). 1994. Water Management: Policies, Guidelines, Provincial Water Quality Objectives of the Ministry of the Environment and Energy. Standards Development Branch.
Ontario Ministry of Natural Resources (MNR). 1990. Environmental Guidelines for Access Roads and Water Crossings. 64 pp. Available at: https://www.ontario.ca/page/environmental-guidelines-access-roads-and-water-crossings.
Ontario Ministry of Natural Resources (MNR). 2019. Ontario Flow Assessment Tool. Available at: https://www.lioapplications.lrc.gov.on.ca/OFAT/index.html?viewer=OFAT.OFAT&locale=en-ca.
Ontario Ministry of Transportation (MTO). 1997. MTO Drainage Management Manual – Part 3. Downsview, ON. Webequie First Nation. 2019a. Webequie First Nation On-reserve Land Use Plan.
Webequie First Nation. 2019b. Webequie First Nation Community Based Land Use Plan. Draft Version 4.3.
| AtkinsRéalis 191 The West Mall Toronto, ON M9C 5L6 Canada 416.252.5315 atkinsrealis.com |
| © AtkinsRéalis except where stated otherwise |